Overview
This section discusses the Daily Load Curve (DLC) and Load Duration Curve (LDC) to understand how system demand is visualized and analyzed.
The Daily Load Curve (DLC)
- The Daily Load Curve represents the actual demand for electricity at each hour or minute of the day.
- It is characterized by changes in its maximum demand, level, shape, and the total energy required, which is represented by the area under the curve.
- When "must-dispatch" variable renewable energy (VRE), such as solar, is added to the grid, it displaces other generation and creates what is known as residual demand or net system demand.
The Load Duration Curve (LDC)
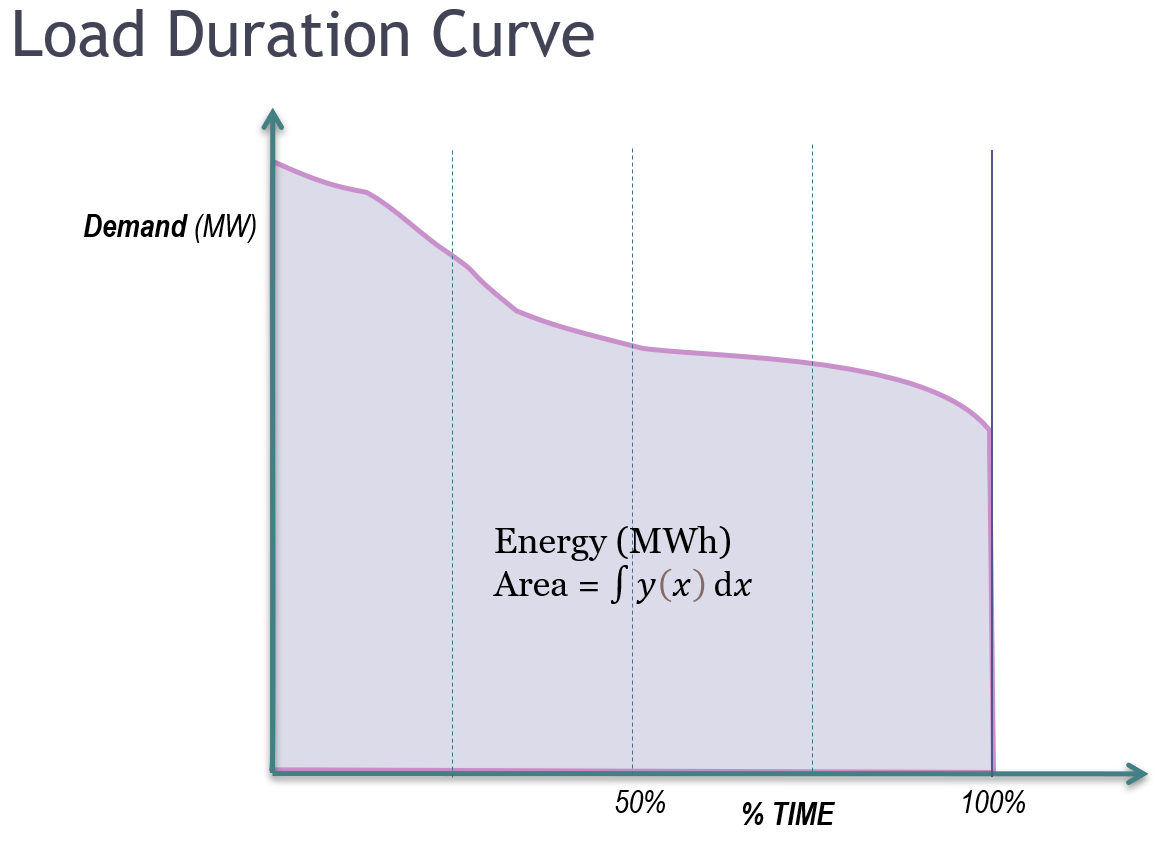 The Load Duration Curve is created by translating the chronological net system demand into the frequency domain.
- Definition: It represents the cumulative probability distribution of Demand (MW) levels across a specified time period (typically a year).
- Axes Interpretation: The Y-axis represents the Demand (MW), while the X-axis represents the % TIME (the percentage of time that a specific load level was equaled or exceeded).
- Energy Calculation: The total system energy (in MWh) is represented by the area under this curve. Mathematically, this area is calculated using the integral:
- Price Duration Curve (PDC): While the LDC applies this cumulative distribution method to demand, applying the exact same sorting principle to market prices creates a Price Duration Curve (PDC).