Let’s Get Started!
Learn about the basics of iPool and Apollo.
This section provides an overview of the iPool software suite, a high-performance simulation system designed for energy market modeling and forecasting within the WESM:
- Core iPool Capabilities
- Supporting Utilities
- Apollo Advanced Visualization
- Common Use Cases
Overview
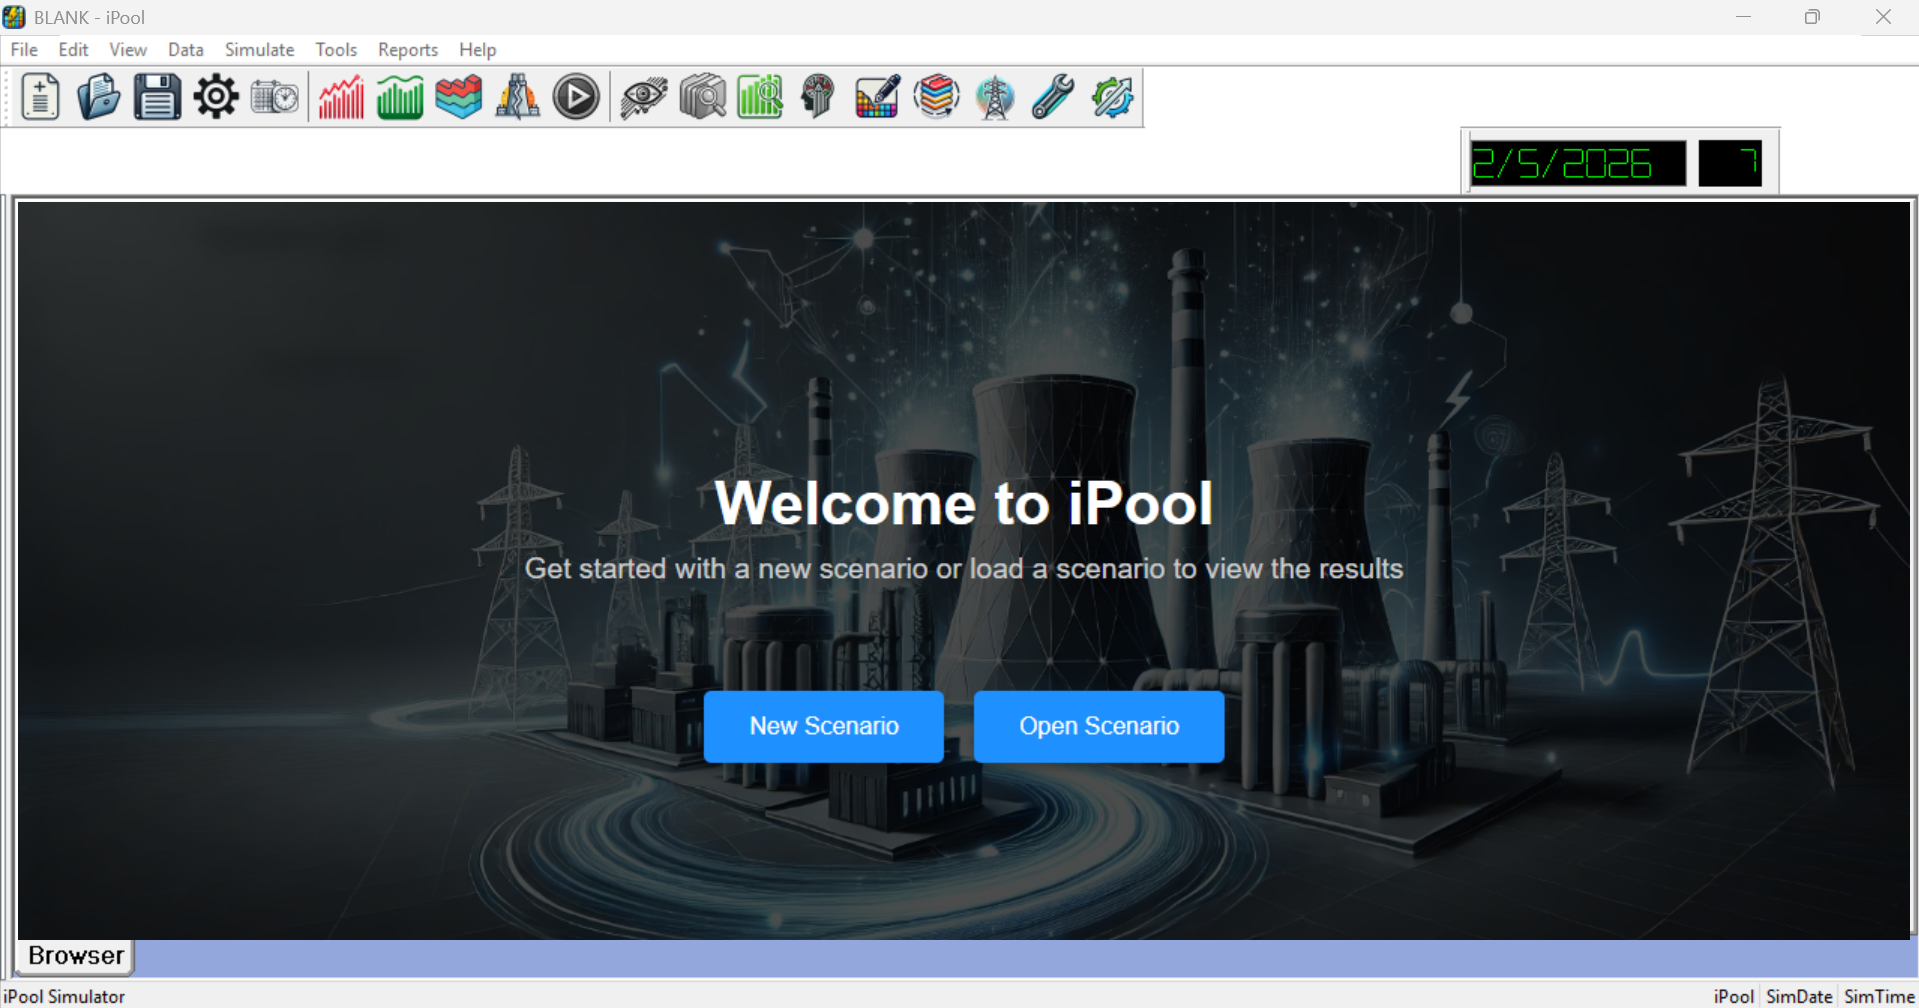
The iPool software utilizes fast state-of-the-art computing technology partnered with visualization and highly efficient storage and data retrieval to provide a high-performance, robust simulation system.
- WESM-Specific Forecasting: Specialized tools for price forecasting and bid-based energy market modeling tailored to IEMOP standards.
- Data Integration & Validation: Seamless integration with IEMOP data for historical analysis and robust model validation.
- Advanced Dispatch Logic: Evaluates cost-based merit orders through Unit Commitment & Economic Dispatch.
- Performs detailed What-If Analysis to evaluate market outcomes under hypothetical conditions.
- Reliability Testing: Built-in Monte Carlo simulations to assess system reliability and risk.
Learn more about iPool here.
Supporting Utilities
Several tools complement iPool to support different stages of market analysis:
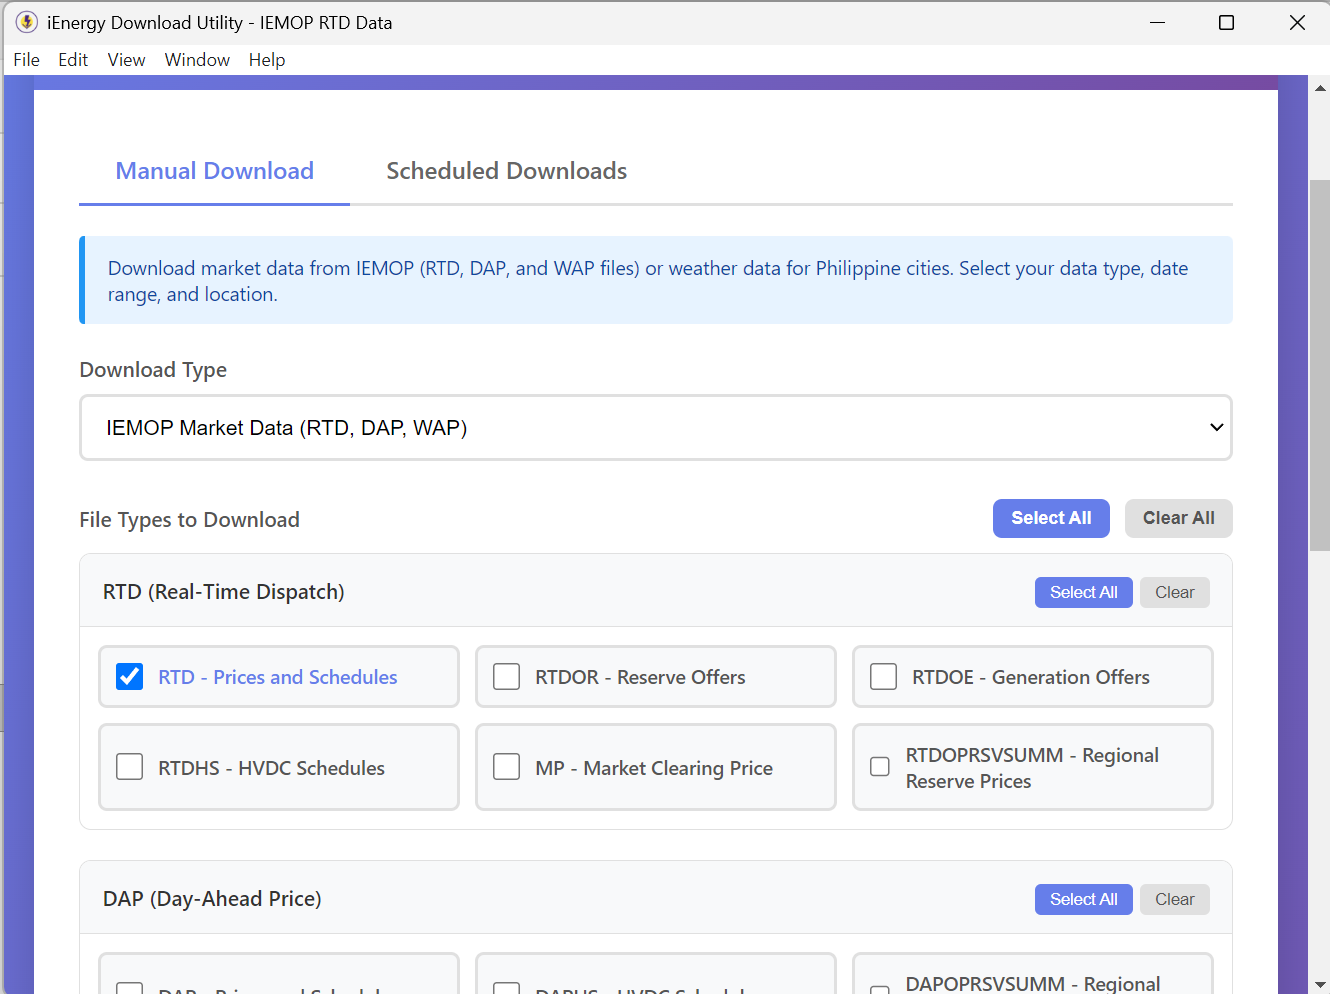
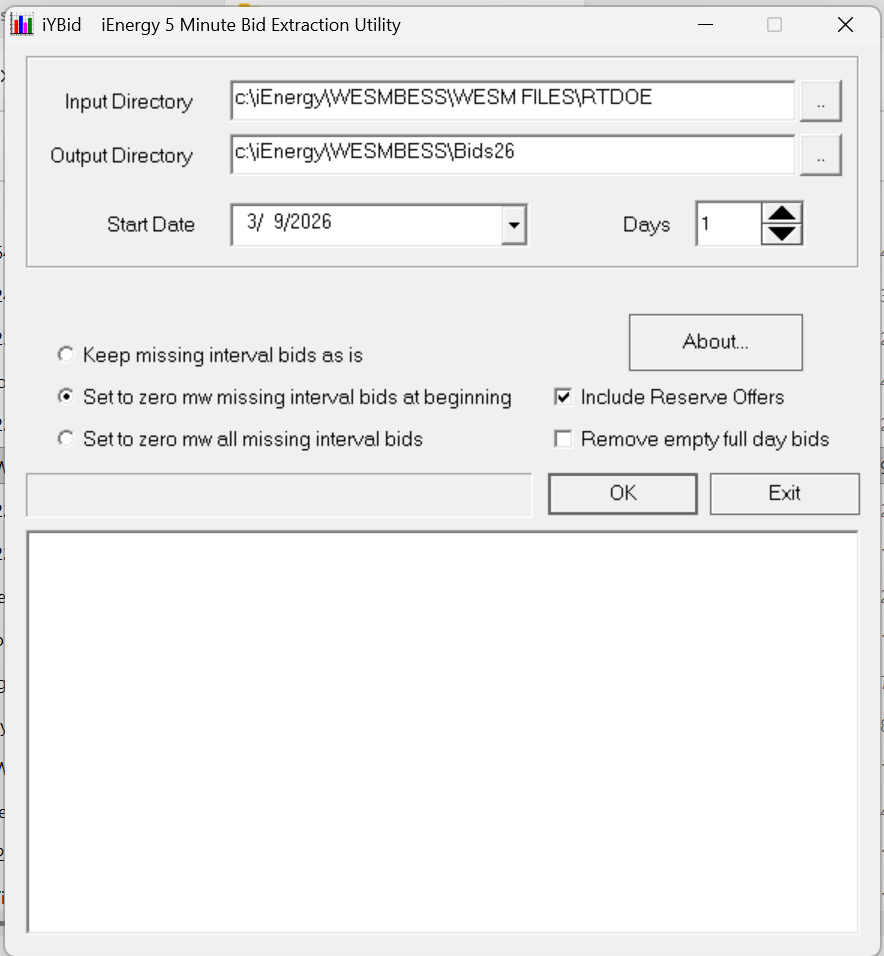
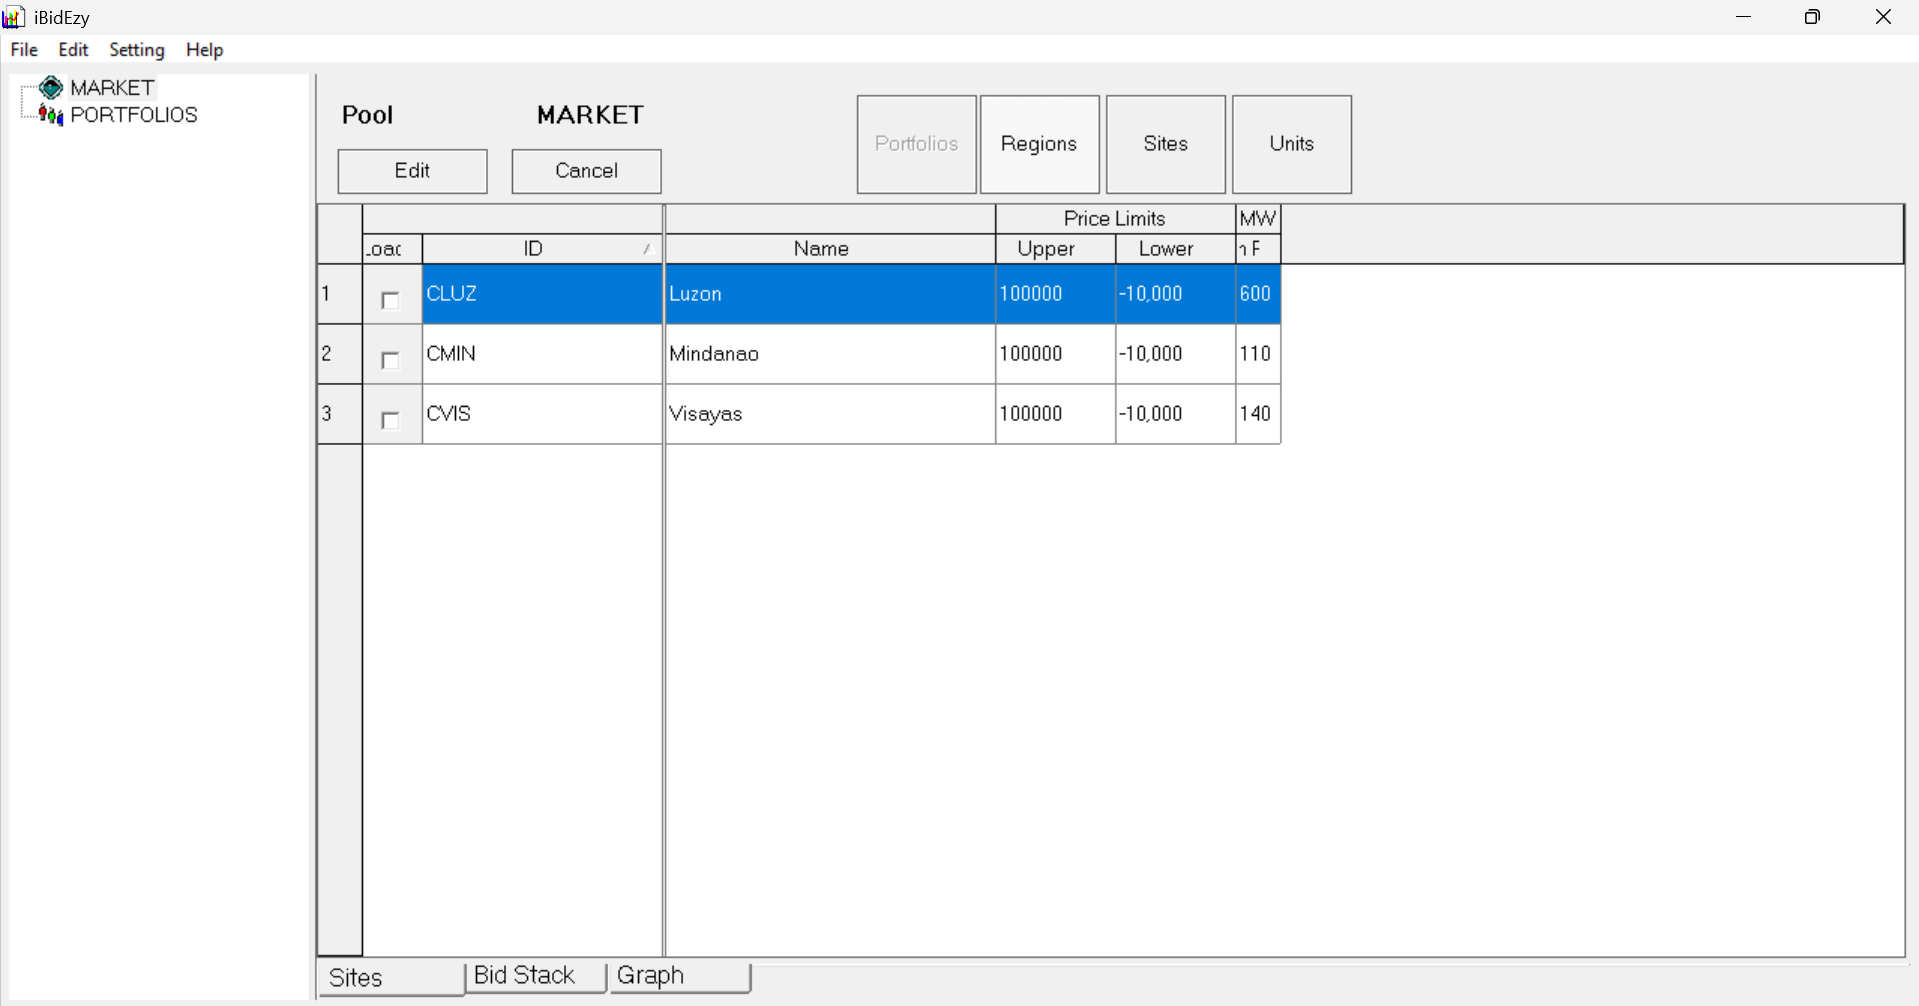
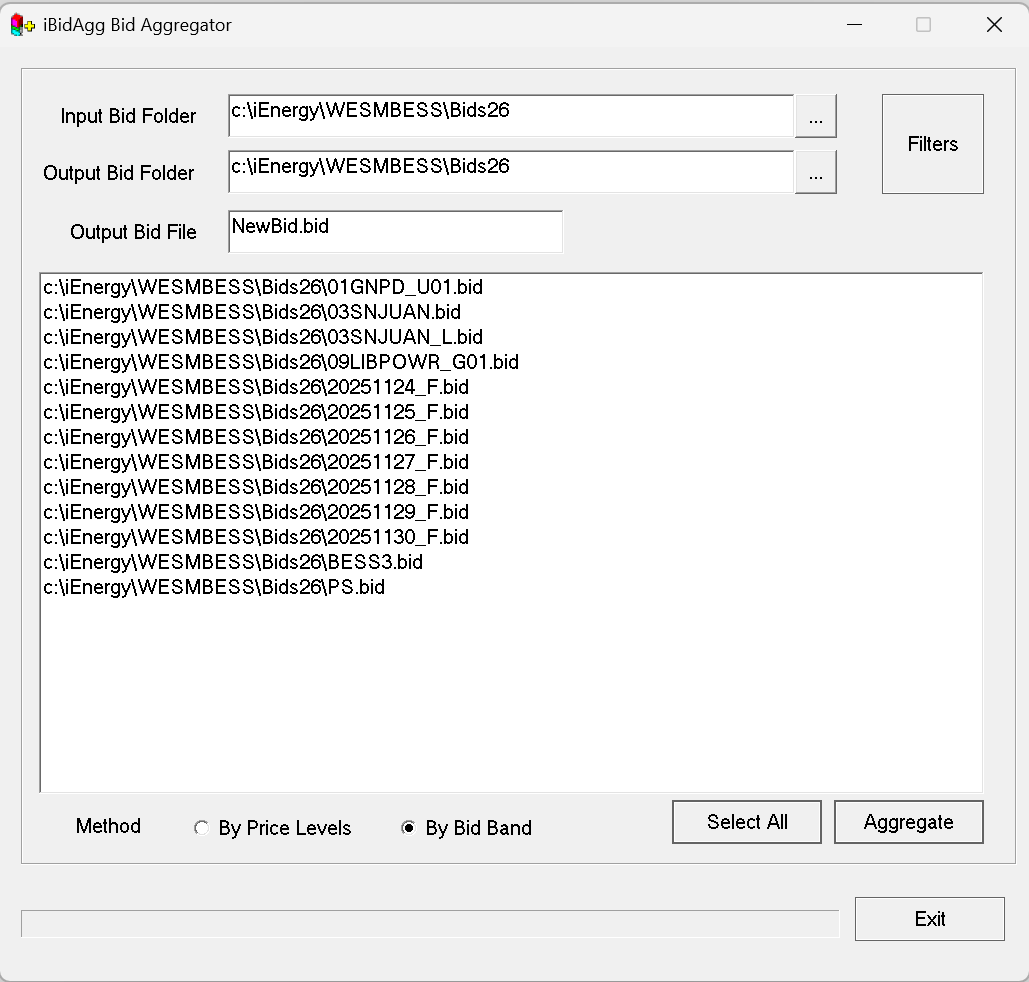
iYBidWESM– A conversion utility that transforms historical bid data into iPool-readable formats for back-testing and historical analysis.iBidAgg– Generates Typical Bids by aggregating historical data, providing a solid baseline for future market forecasting.iBidEzy– A user-friendly editor for creating custom, "what-if" bid profiles to test various market scenarios.iEnergy Downloader– A downloader utility for WESM real-time, day-ahead, and week-ahead data. It also includes weather data for specific cities across the Philippines.
(Link to section for Utilities)
Apollo
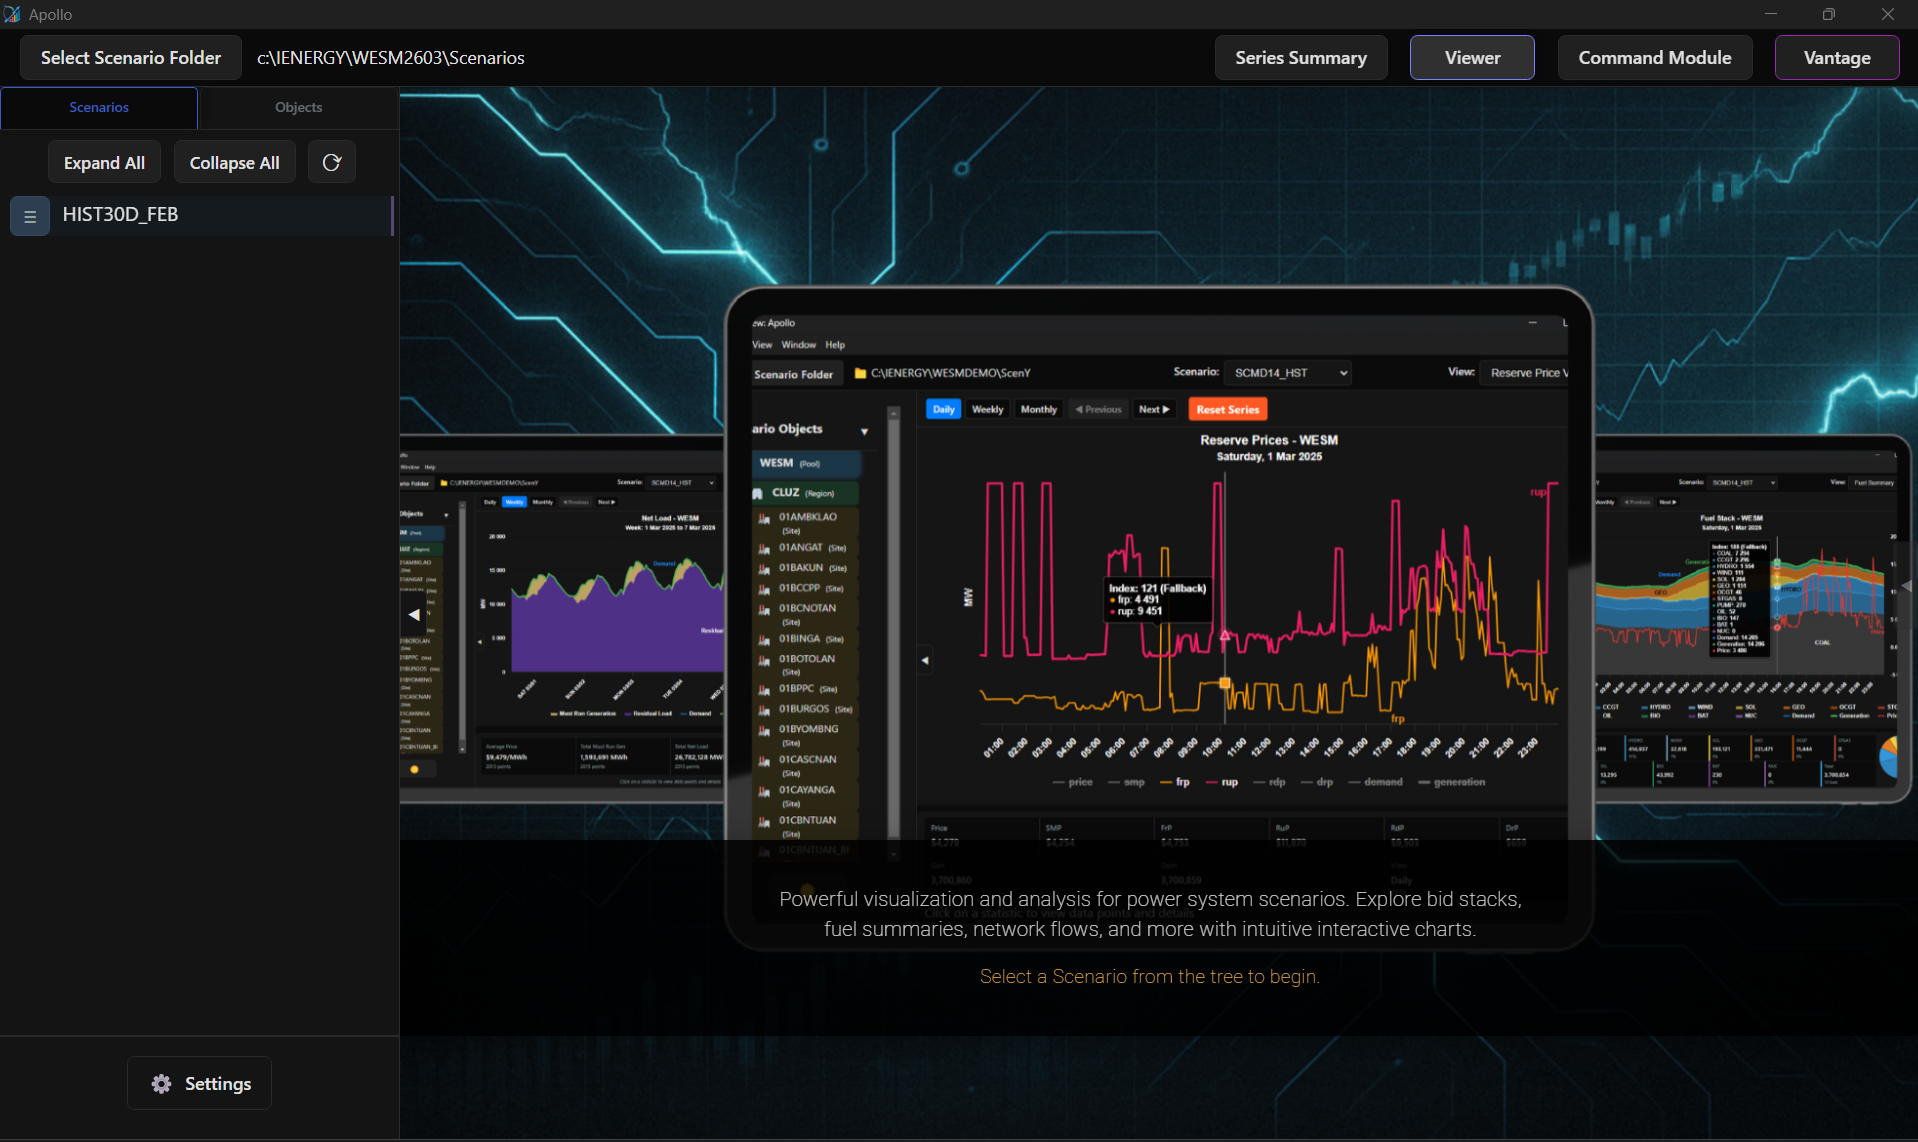
Apollo enhances post-market analysis and forecasting through advanced visualizations and scenario comparisons. It enables analysts to:
-
Data Visualization & Comparison
- Series Summary: Quickly compare key performance indicators across different simulation runs.
- Comparison View: Perform side-by-side, chart-based analysis of multiple scenarios to easily identify trends and outliers.
- Custom Graphics: Fully customizable graphing tools to meet your specific reporting or analytical requirements.
-
Advanced Analytical Modules
- Intelligent Scenario Designer: A template-based system for rapid setup. Easily configure Monte Carlo settings, bid scaling, and dispatch flags without starting from scratch.
- Specialized Storage Analytics: Dedicated tracking for energy storage systems.
- Interactive Command Module: A sophisticated interface for automating simulation sequences, ensuring your workflows are reproducible and highly efficient for sensitivity analysis.
Learn more about Apollo here.
iPool Analytical Pipeline
Together, these utilities, iPool and Apollo support market forecasting, what-if scenario analysis, and other market case studies.

Learn more about iPool Inputs and Outputs here.
Common Use Case
Some of the most common functions of iPool are running a historical load for post‑market analysis, forecasting, and what-if analysis. These can be done in two ways: using batch files or the command module of Apollo.
Learn more about these:
- Historical Load (Command Module | Batch File)
- Short-term Forecasting (Command Module | Batch File)
- What-if Simulation (Command Module | Batch File)