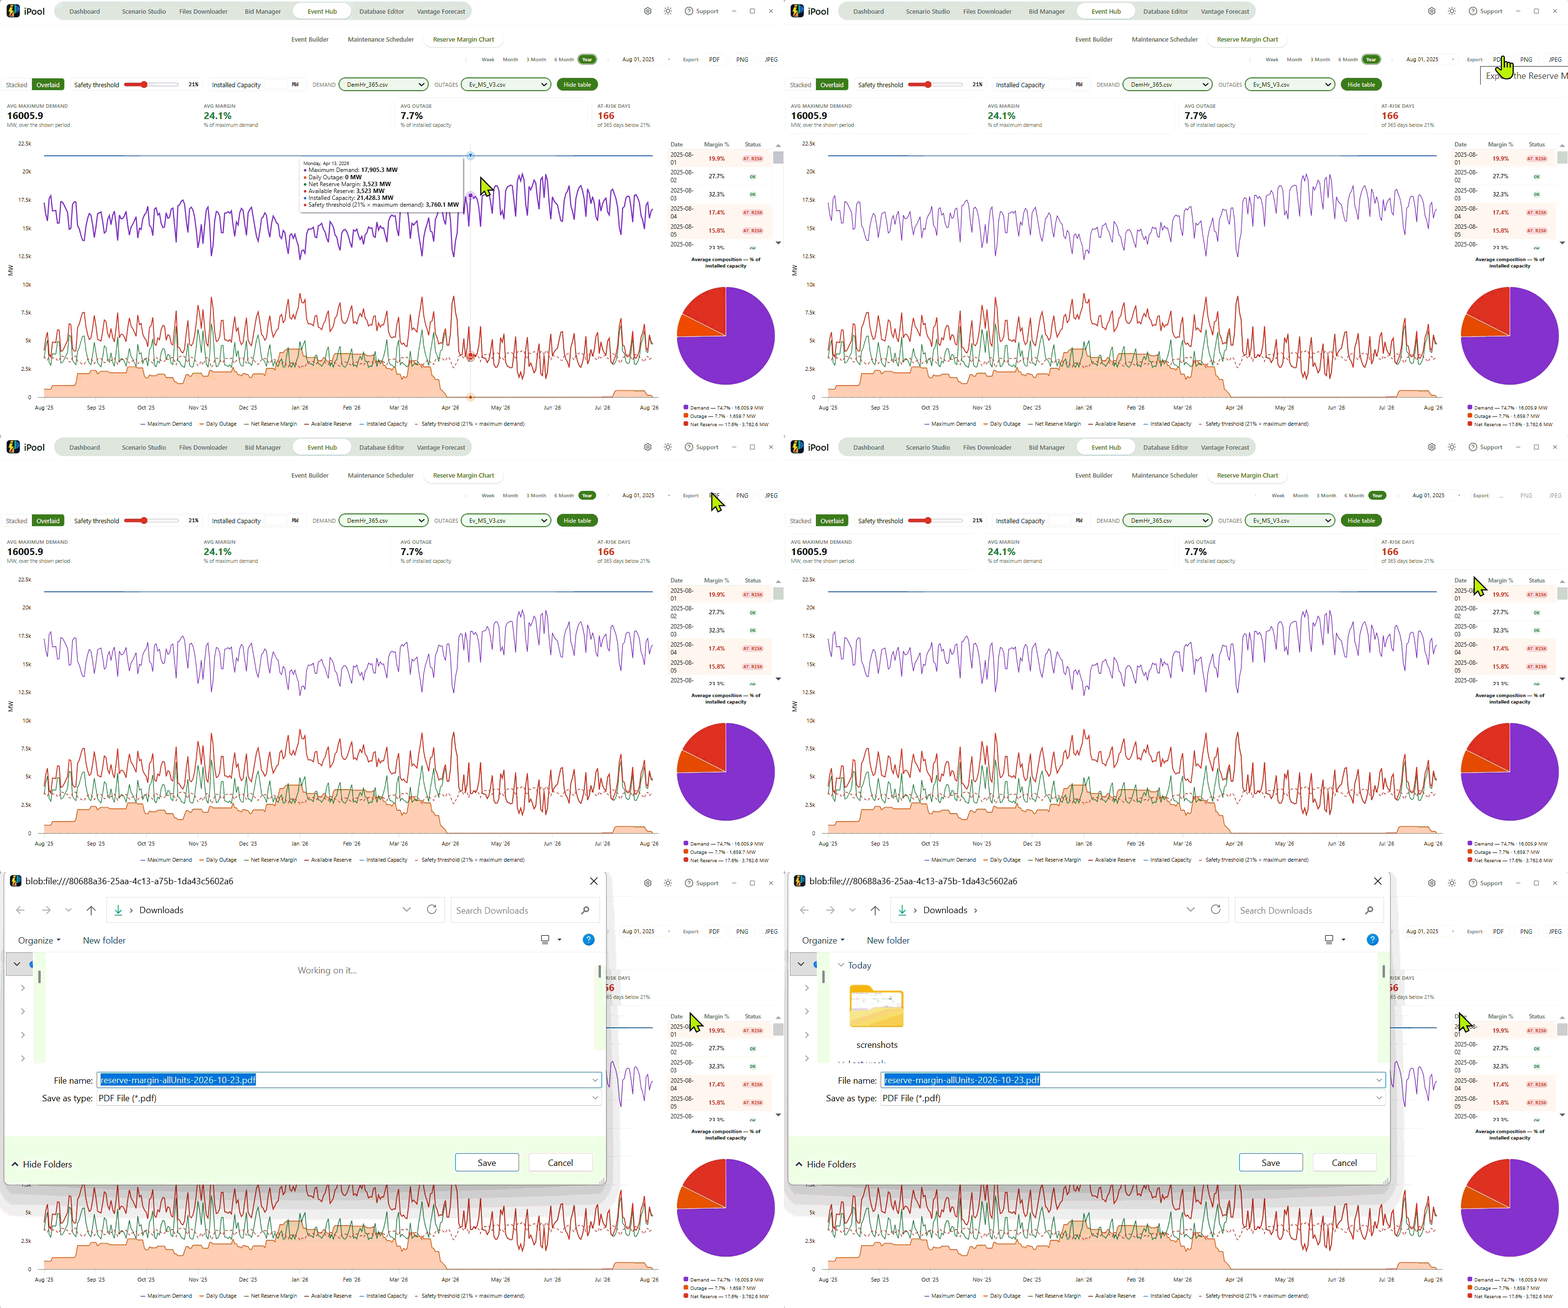
Reserve Margin Chart
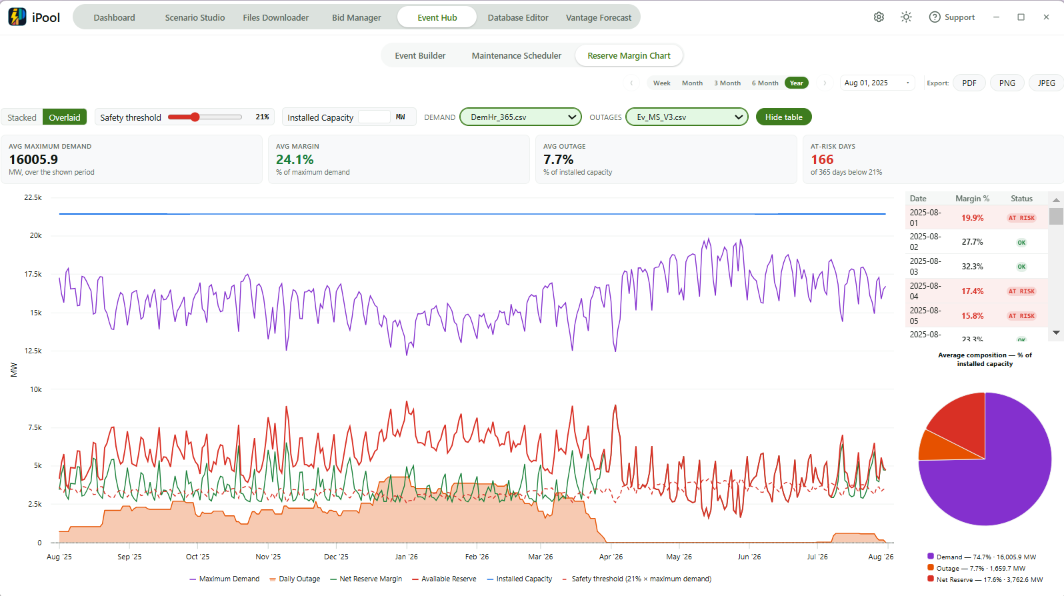
The Reserve Margin Chart plots installed capacity, daily outage, and maximum demand as a stacked area chart, showing the computed net reserve margin per day across a loaded time range. It reads a demand CSV and an event/outage CSV, fetches installed capacity from the SysWESM database, and updates the chart, KPI summary, and readout table automatically when inputs change.
- Data Inputs
- Time Window
- Reading the Chart
- States
- Export
Configure the three data sources before the chart can populate: installed capacity (from the database), a demand CSV, and an event/outage CSV.
Installed Capacity
Installed capacity is read automatically from the SysWESM database at DirDB (resolved via the working environment's Defaults.csv), summing all units where Supply = 1 and Status = 1 in the WESM pool.
An optional Installed Capacity number field overrides the database-derived value when filled; click × to clear the override. The override value persists across sessions.
When an override value is in effect, an override active label appears beside the Installed Capacity field as a reminder that the chart is using the entered value rather than the database total.
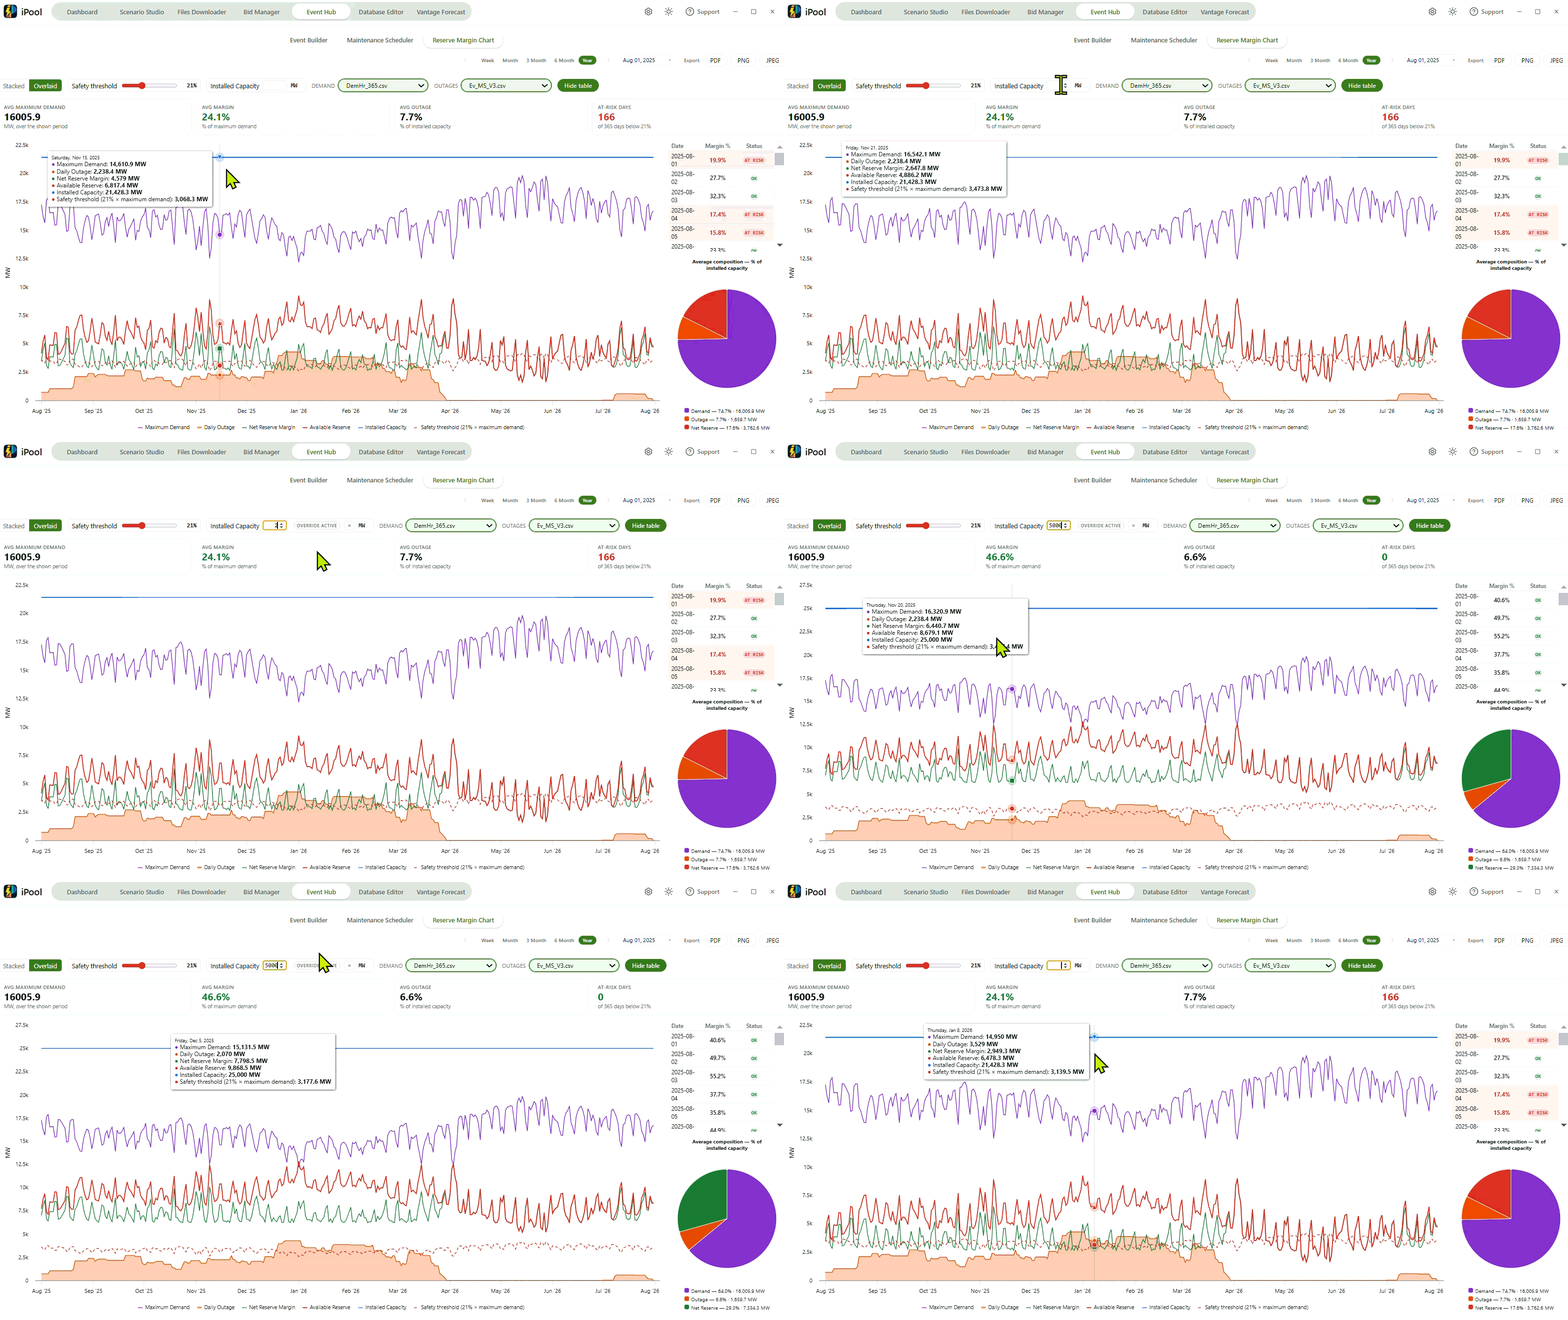
Demand File
Select a demand CSV from the Demand dropdown, which lists .csv files from DirDem. The first option is always "Browse other location…" to open a native file picker for files outside DirDem. The dropdown shows a placeholder "Choose demand file" until a selection is made. Hovering over the dropdown shows the full path of the loaded file. Hovering the dropdown over an already-loaded file refreshes the listing from disk.
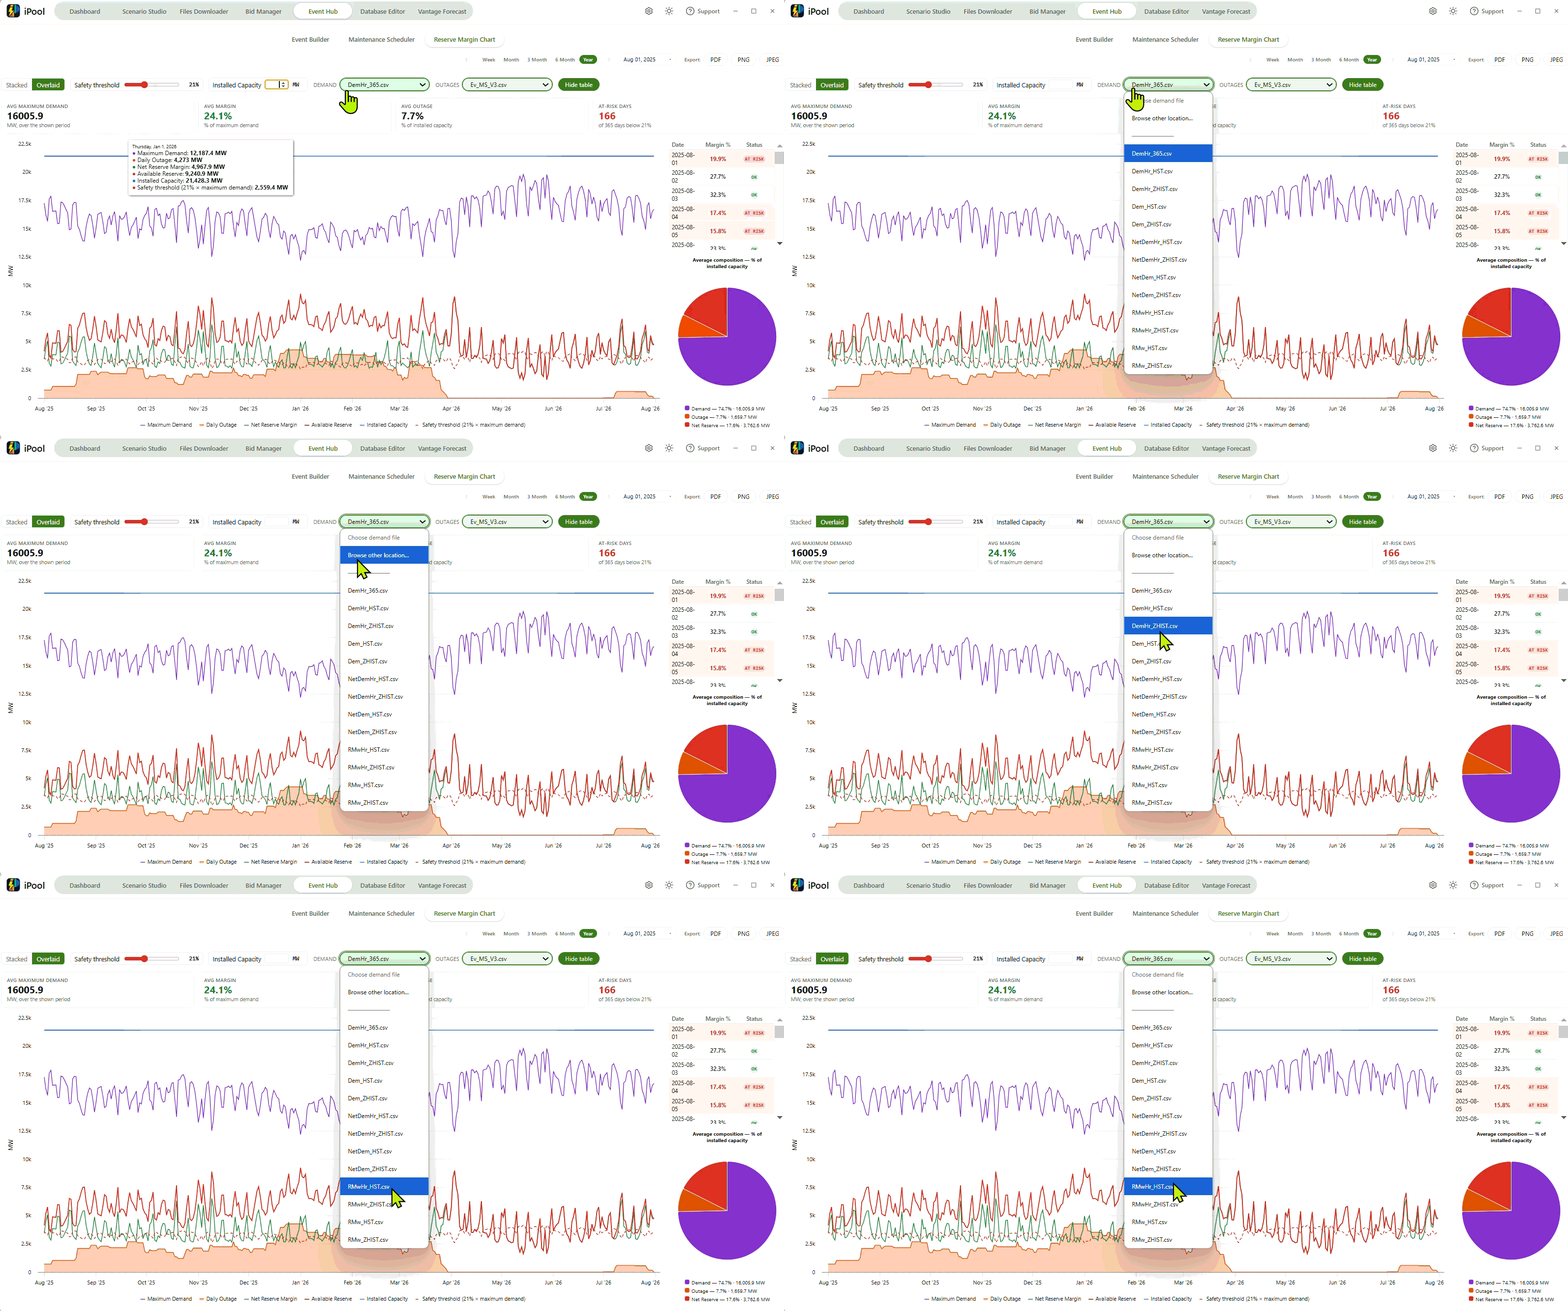
Outages File
Select an event/outage CSV from the Outages dropdown. This dropdown has the same structure as the Demand dropdown: files from DirEvt, "Browse other location…" always first, placeholder "Choose event file". After both files are selected, the chart, KPI cards, and readout table populate automatically. Only days present in both the demand and outage series contribute to the chart; days present in only one source are discarded, and a warning count is shown.
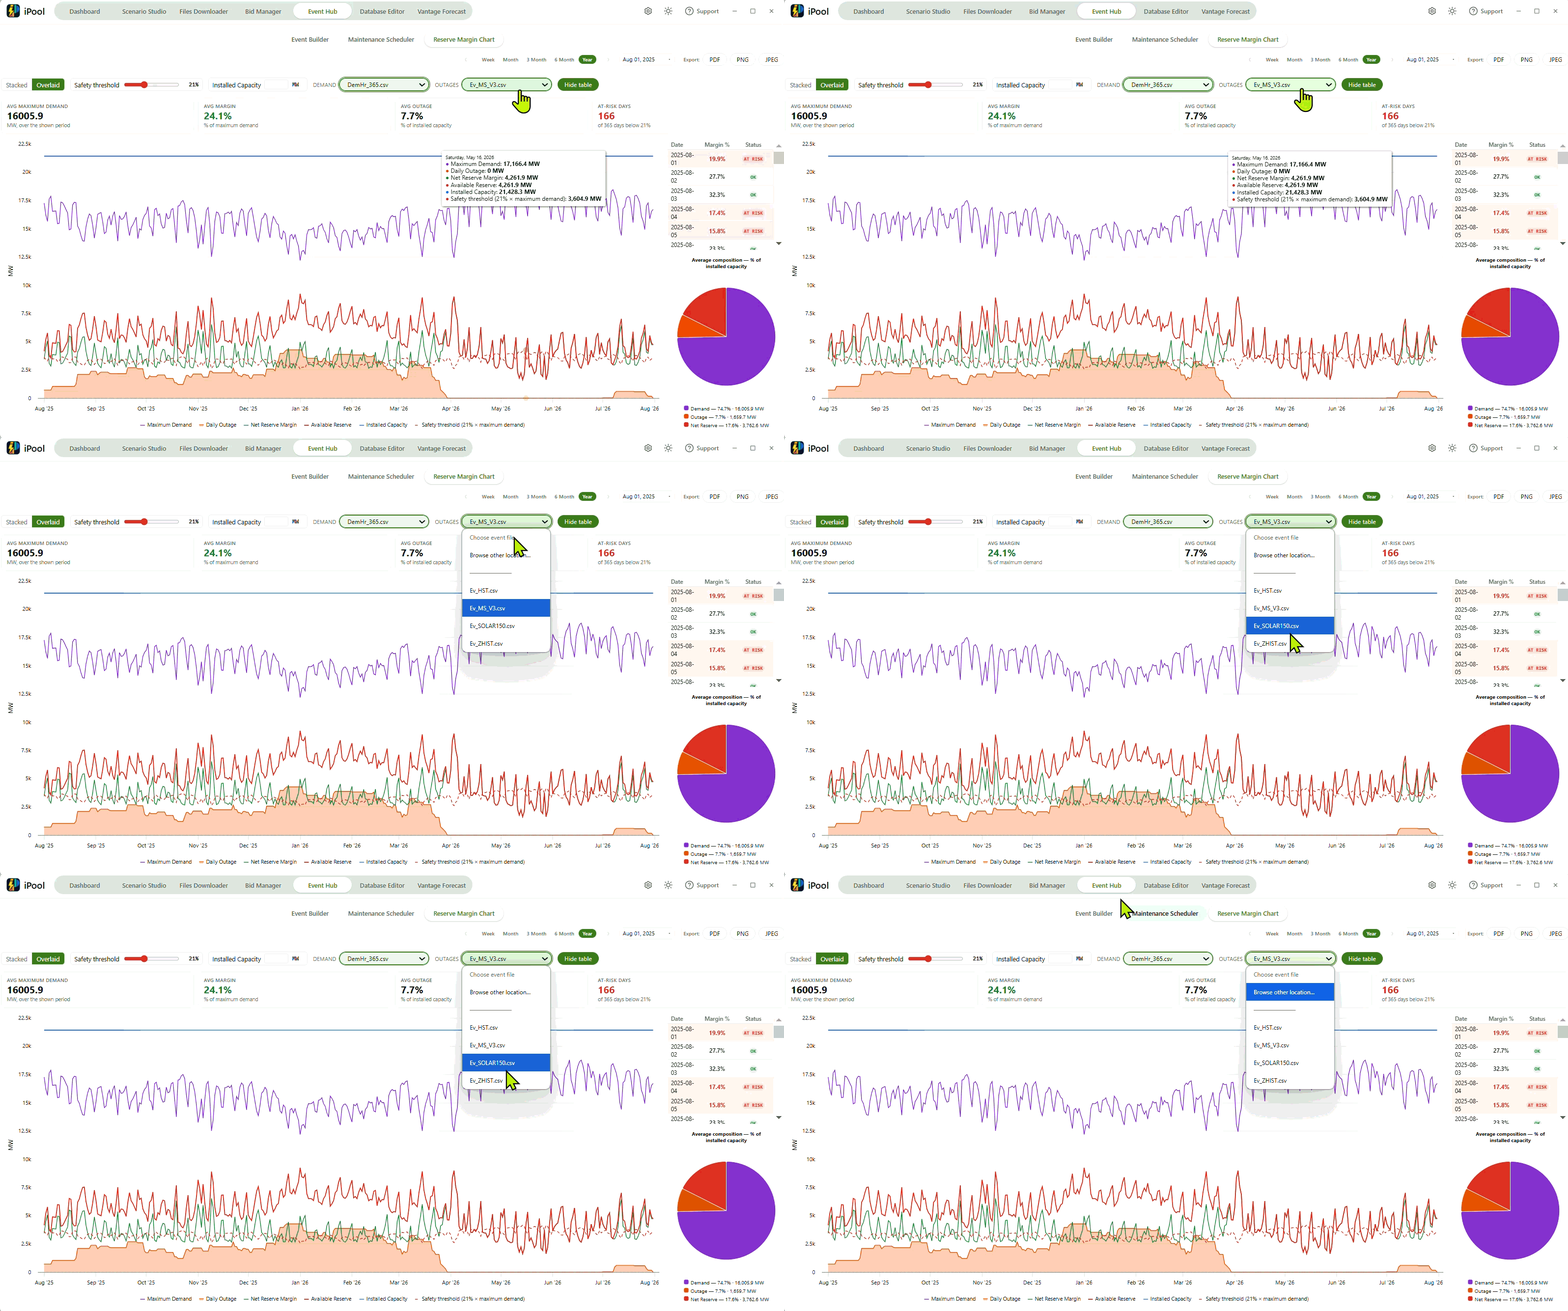
Use the toolbar and options row to set the displayed time window and adjust chart behaviour.
Window Navigation
Use the toolbar controls to navigate the time window displayed on the chart:
- ‹ / › Prev/Next buttons step the window one increment (disabled at the range edges).
- Five buttons set the window width: Week, Month, 3 Month, 6 Month, Year. Defaults to Week.
- The calendar date-picker jumps to any date within the loaded data range.
- Jump to Today snaps the window anchor to today's date; only shown when today falls within the loaded data range.
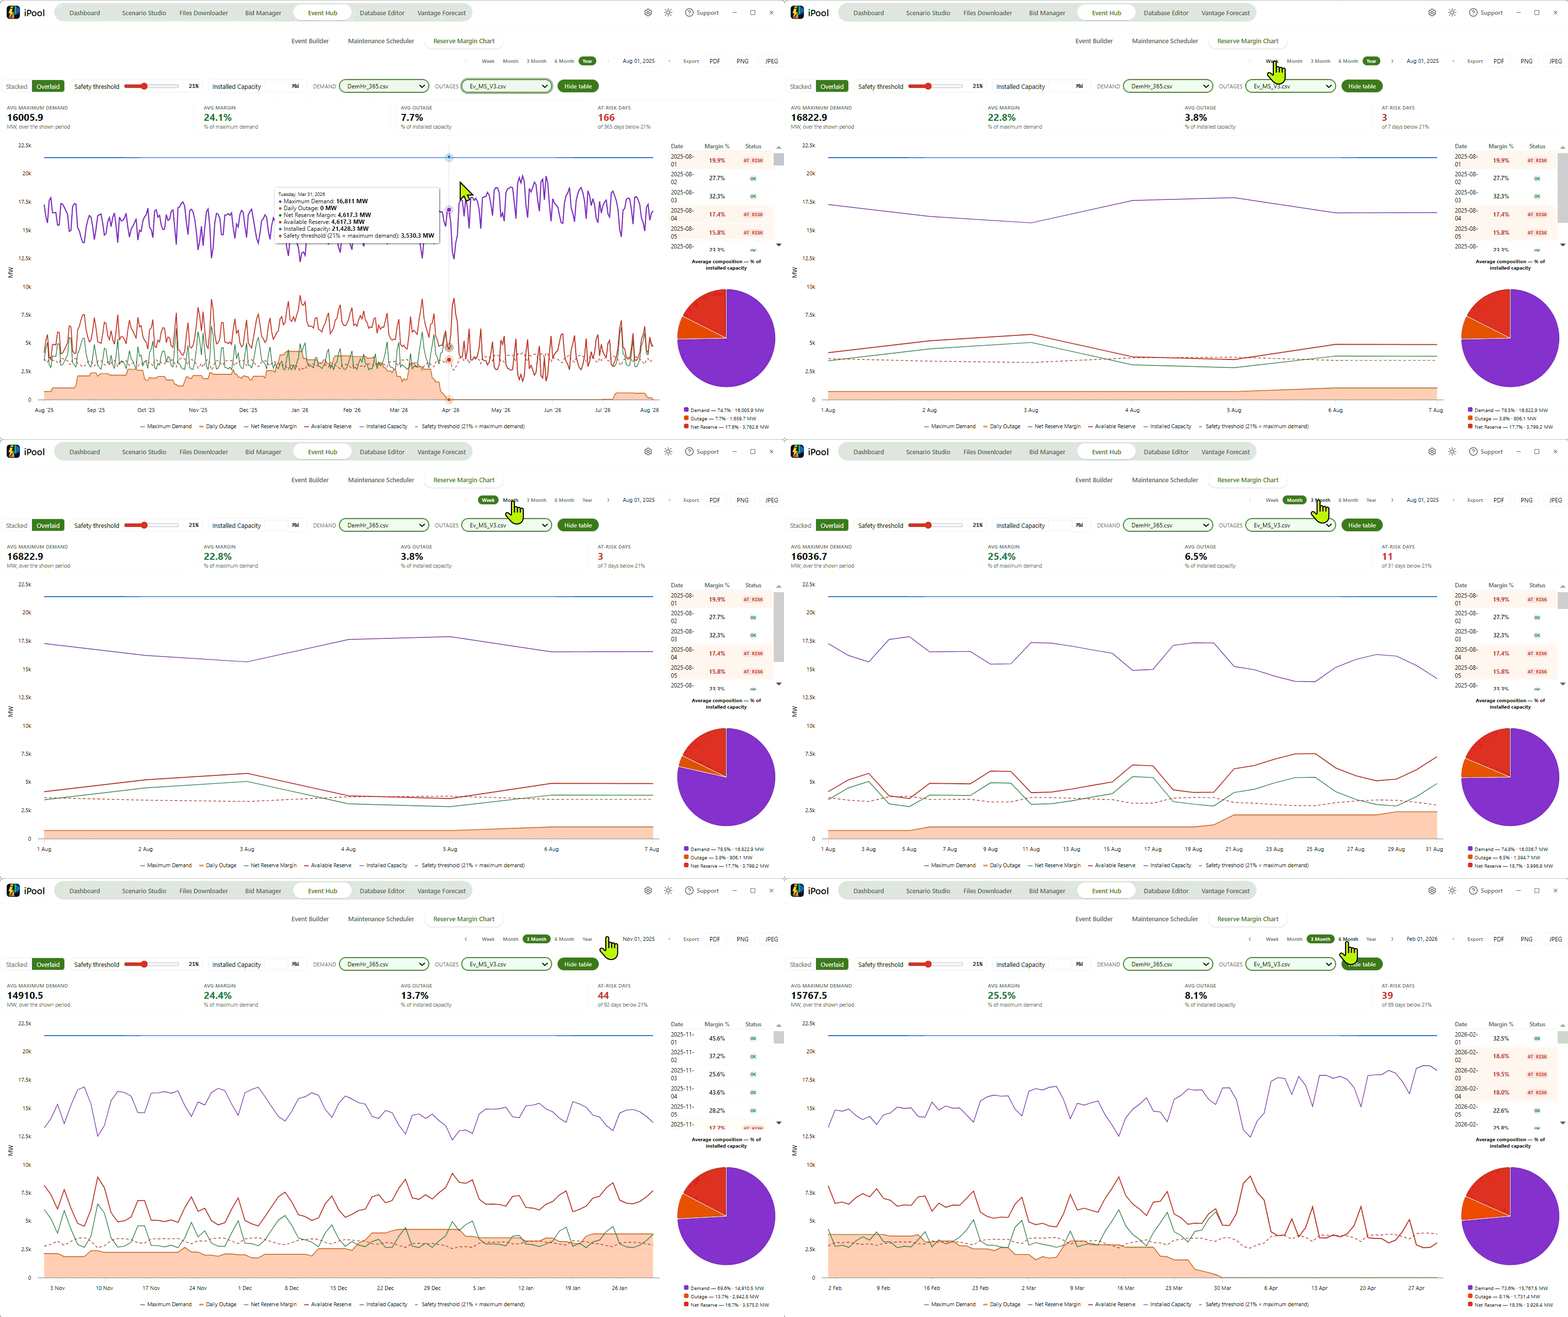
Chart Options
The options row below the toolbar provides three adjustments:
- Stacked / Overlaid toggle: Stacked renders series as additive areas (Net Reserve, Daily Outage, Maximum Demand stacked bottom-to-top); Overlaid draws each series independently with lighter shading and adds an Installed Capacity overlay line. Default is Overlaid.
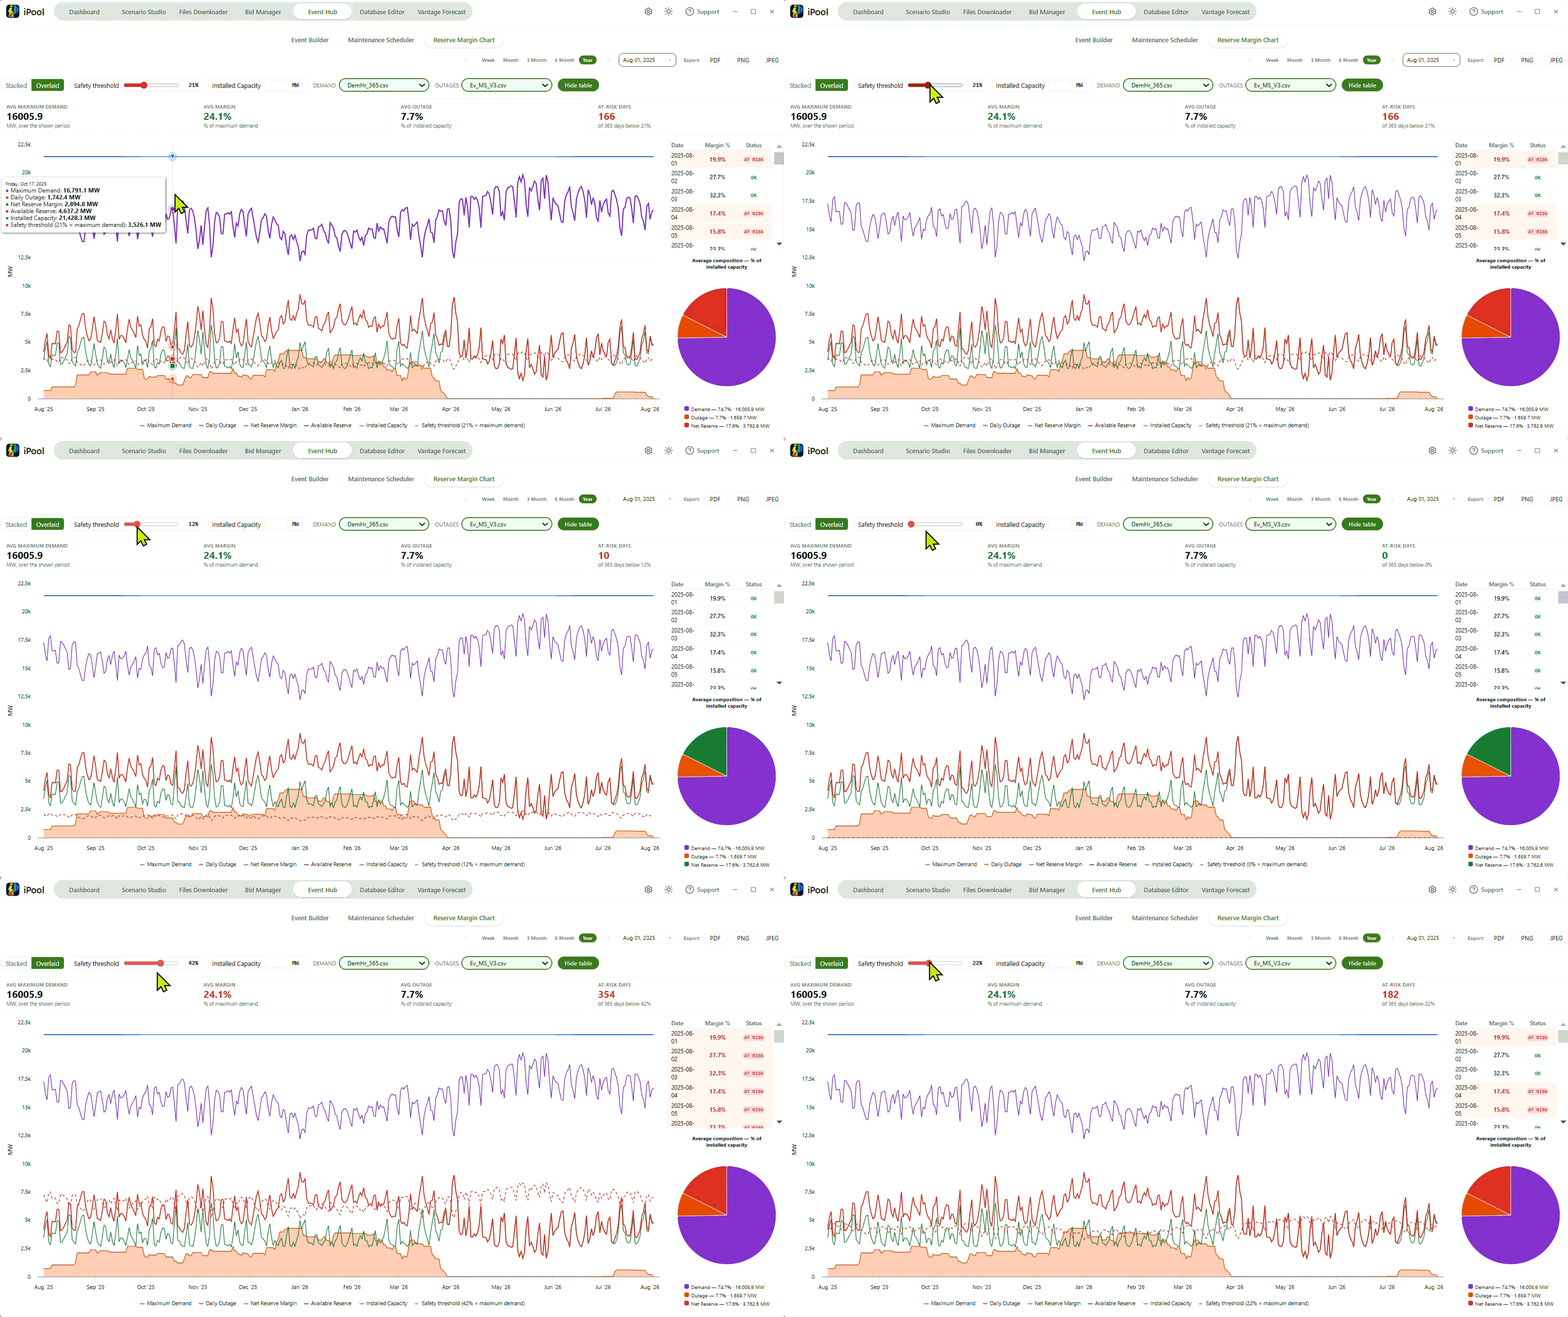
- Safety threshold slider (0–60%, default 21%): moves a dashed red threshold line on the MW chart and updates the "At-risk days" KPI count and the pie chart's colour split. Adjusts live on drag.
- Hide table / Show table button: collapses or expands the right-hand panel (KPI pie chart and readout table). When collapsed, the MW chart expands to full width. Persists across sessions.
Understand the chart series, tooltips, KPI cards, and the readout table.
Series and Legend
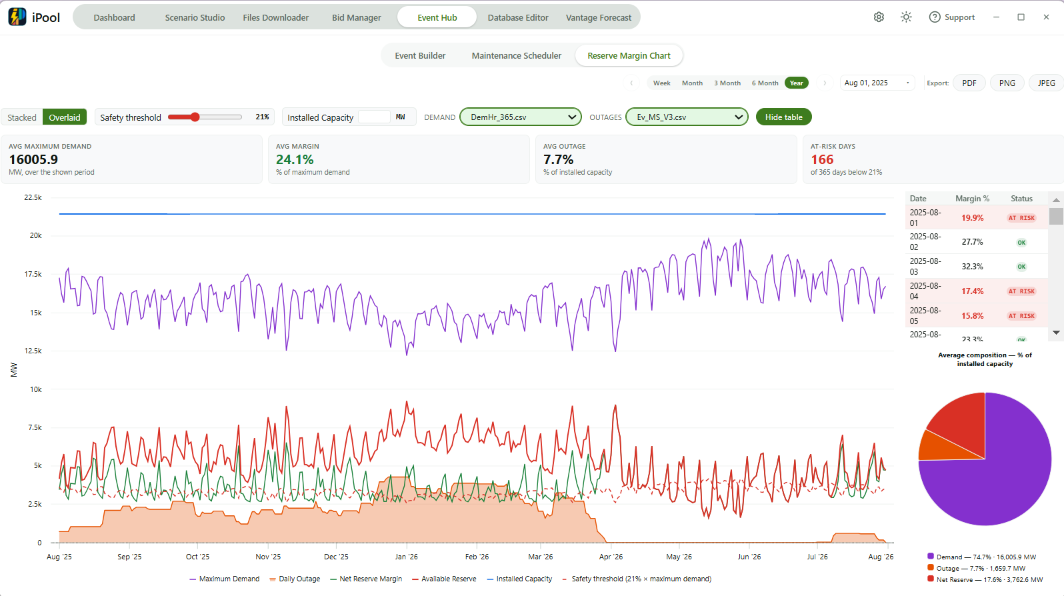
The MW chart displays up to five series (colours fixed to the site theme):
- Net Reserve Margin (green area): net reserve after outages.
- Daily Outage (orange area): total outage MW per day from the selected event file.
- Maximum Demand (purple area): maximum demand MW per day from the selected demand CSV.
- Available Reserve (red solid line): installed capacity minus maximum demand per day.
- Safety threshold (N% × maximum demand) (red dashed line): the threshold line label includes the current percentage, e.g.
Safety threshold (21% × maximum demand); only shown when threshold > 0.
In Overlaid mode an Installed Capacity overlay line (blue) is added when an installed capacity value is available. Negative Net Reserve Margin days (deficit) render as a dip below zero in Stacked mode; in Overlaid mode the net margin series uses a red fill for deficit segments.
A companion pie chart on the right-hand panel shows the window-average proportions of Net Reserve, Daily Outage, and Maximum Demand.
Tooltips
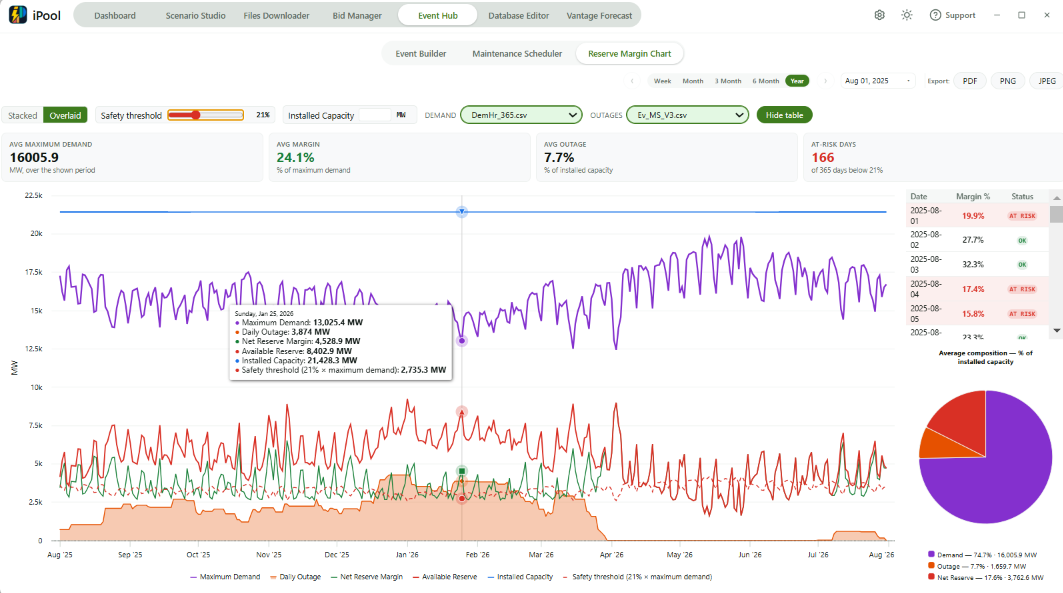
Hovering over the chart shows a tooltip for each series at that day:
● {series name}: {N} MW
Each line is prefixed with a coloured bullet in the series' colour. The safety threshold line tooltip shows its dynamic label, e.g. Safety threshold (21% × maximum demand).
KPI Cards and Readout Table
Four KPI cards above the chart summarise the visible window:
- Avg maximum demand — average daily peak demand (MW) over the shown period.
- Avg margin — average net reserve margin as a percentage of maximum demand; coloured relative to the safety threshold.
- Avg outage — average daily outage as a percentage of installed capacity (shows
—when no installed capacity value is available). - At-risk days — count of days where net reserve margin falls below the safety threshold; coloured and labelled with the window range phrase.
The readout table on the right-hand panel lists one row per day with columns: Date · Installed MW · Peak Demand MW · Available Reserve MW · Daily Outage MW · Net Reserve Margin MW. Rows where Net Reserve Margin is negative carry a deficit highlight. A label next to the Available Reserve MW column header reads computed = Installed − Peak; when a manual installed-capacity override is active, this label changes to manual override.
The chart shows different messages depending on the current data load state.
Empty, Loading, and Error States
| Condition | Message shown |
|---|---|
| No files loaded (initial state) | Choose a Max Demand CSV and an Event/Outage CSV from the dropdowns |
| Loading in progress | Loading reserve-margin data… |
| Demand and outage CSVs have no dates in common | The picked demand and outage CSVs have no dates in common. |
| The selected CSV could not be read | An error message is shown. |
| Export error | An error message is shown in the toolbar. |
Capture the MW chart as a file in PDF, PNG, or JPEG format.
Export Chart
Click PDF, PNG, or JPEG in the toolbar's export group to capture the MW chart. The export captures the MW area chart element only — KPI cards, the readout table, and the toolbar controls are excluded. All three format buttons are disabled while an export is running; the active button shows … and the others retain their labels. The export filename includes the suffix -allUnits, or -override when a manual installed-capacity override is active.