Event Hub
Event Hub is one of the main module tabs in iPool Suite. It provides three sub-tabs — Event Builder, Maintenance Scheduler, and Reserve Margin Chart — each a specialised tool for working with market event files and derived analysis. Open the Event Hub by selecting its tab in the Suite main navigation; sub-tab state is preserved across switches.
- Event Builder
- Maintenance Scheduler
- Reserve Margin Chart
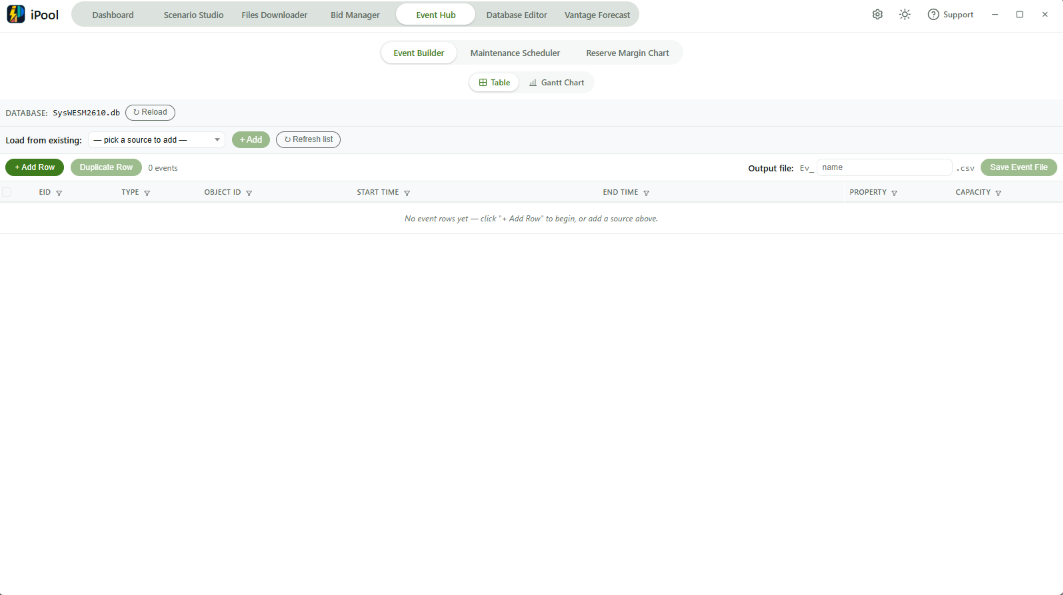
The Event Builder sub-tab provides two inner views for working with event CSV files: a Table view for creating and editing events, and a Gantt Chart view for visualising outage timelines.
Table View
The Table view is a row-editor for building event CSV files. Each row specifies an event with fields EID, Type, Object ID, Start Time, End Time, Property, and Capacity. Files are read from and saved to the DirEvt directory (Ev_*.csv). The database catalogue — Type, Object ID, and Property dropdown options — is resolved from the working environment's SysWESM database.
See the full walkthrough: Event Builder — Table — Interface and Navigation.
Gantt Chart View
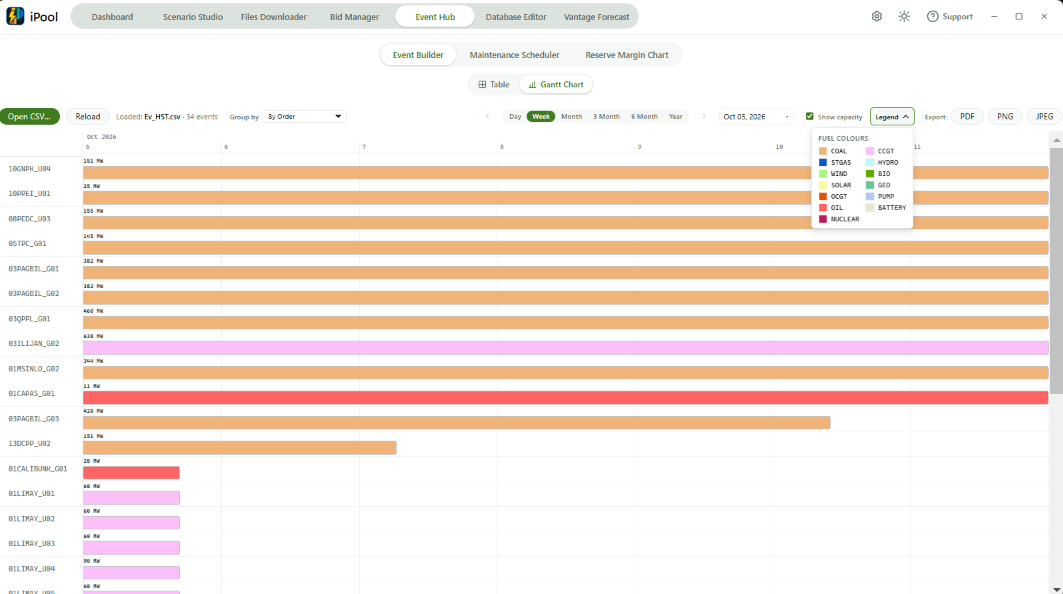
The Gantt Chart view is a read-only timeline display of outage events from a CSV file. The file columns are RegionID, UnitID, StartDate, EndDate, CapOnOutage, and Order. The view supports grouping, timeline navigation, and export to PDF, PNG, or JPEG. No write operations are available in this view.
See the full walkthrough: Event Builder — Gantt Chart — Interface and Navigation.
The Maintenance Scheduler sub-tab computes a 365-day maintenance schedule and writes event output files to DirEvt.
Maintenance Scheduler
The Maintenance Scheduler computes a 365-day maintenance schedule from demand data, a SysWESM database, and an event file. It produces up to five CSV output types in DirEvt. Three scheduling methods are available to control how maintenance windows are assigned across the year.
See the full walkthrough: Maintenance Scheduler — Overview.
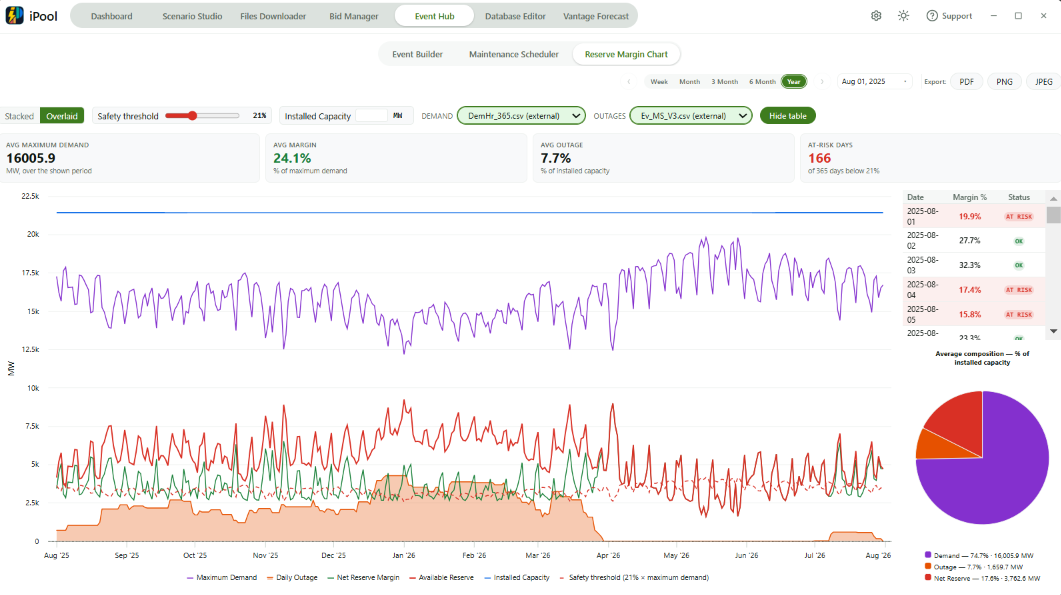
The Reserve Margin Chart sub-tab visualises installed capacity, daily outage, and maximum demand as a chart, and computes the net reserve margin per day.
Reserve Margin Chart
The Reserve Margin Chart visualises installed capacity, daily outage, and maximum demand as a stacked or overlaid area chart, computing the net reserve margin per day. Inputs are a demand CSV (from DirDem) and an event/outage CSV (from DirEvt); installed capacity is fetched from the SysWESM database. The chart, KPI summary, and readout table update automatically when inputs change.
See the full walkthrough: Reserve Margin Chart.