Interface and Navigation
This page walks you through the Gantt Chart in five phases: loading a CSV file, reading what the chart is showing you, navigating the timeline, grouping and colouring the lanes (with the fuel legend as its companion), and finally exporting a snapshot. Each phase below is one tab of the walkthrough.
- Phase 1: Load a CSV file
- Phase 2: Read the chart
- Phase 3: Navigate the timeline
- Phase 4: Group, colour, and read the legend
- Phase 5: Export a snapshot
Start by loading the CSV that drives the chart.
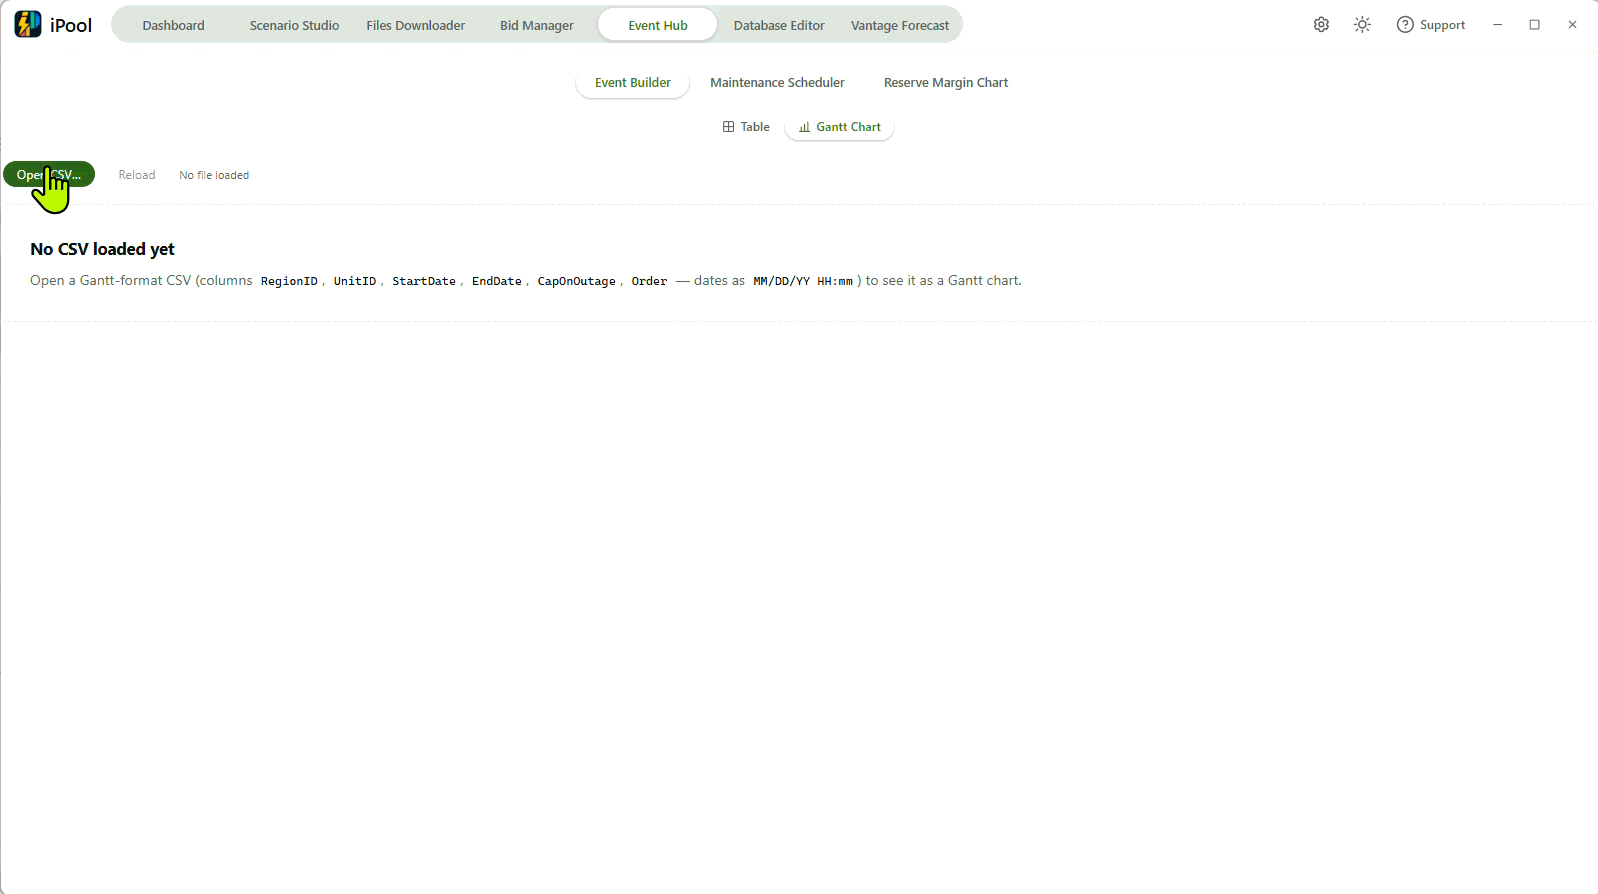
Open a CSV file
The chart starts empty; press Open CSV… to load a file. The
expected columns are RegionID, UnitID, StartDate, EndDate,
CapOnOutage, Order, with dates written as MM/DD/YY HH:mm.
The file dialog opens at DirEvt when DirEvt is configured in the
working environment; if DirEvt is not set the dialog opens at the
system default location.
Before a file is loaded the chart shows an empty state reading
**No CSV loaded yet** together with the same expected column list.
The Reload button next to Open CSV re-runs the last parse against
the current catalog; it is disabled until a file has been loaded.
Above the chart, a status line shows what file is loaded.
When data is loaded it reads Loaded: **{fileName}** · {N} events;
when no file is loaded it reads No file loaded. If the parser
emitted warnings while reading the file — for example unsupported
event types such as Pool, Region, or Storage, or DUIDs listed on
Site/Sites rows that could not be resolved against the catalog — an
informational note appears below the status line describing them.
Learn what the chart's axes, bars, and today marker mean once data is on screen.
Chart layout
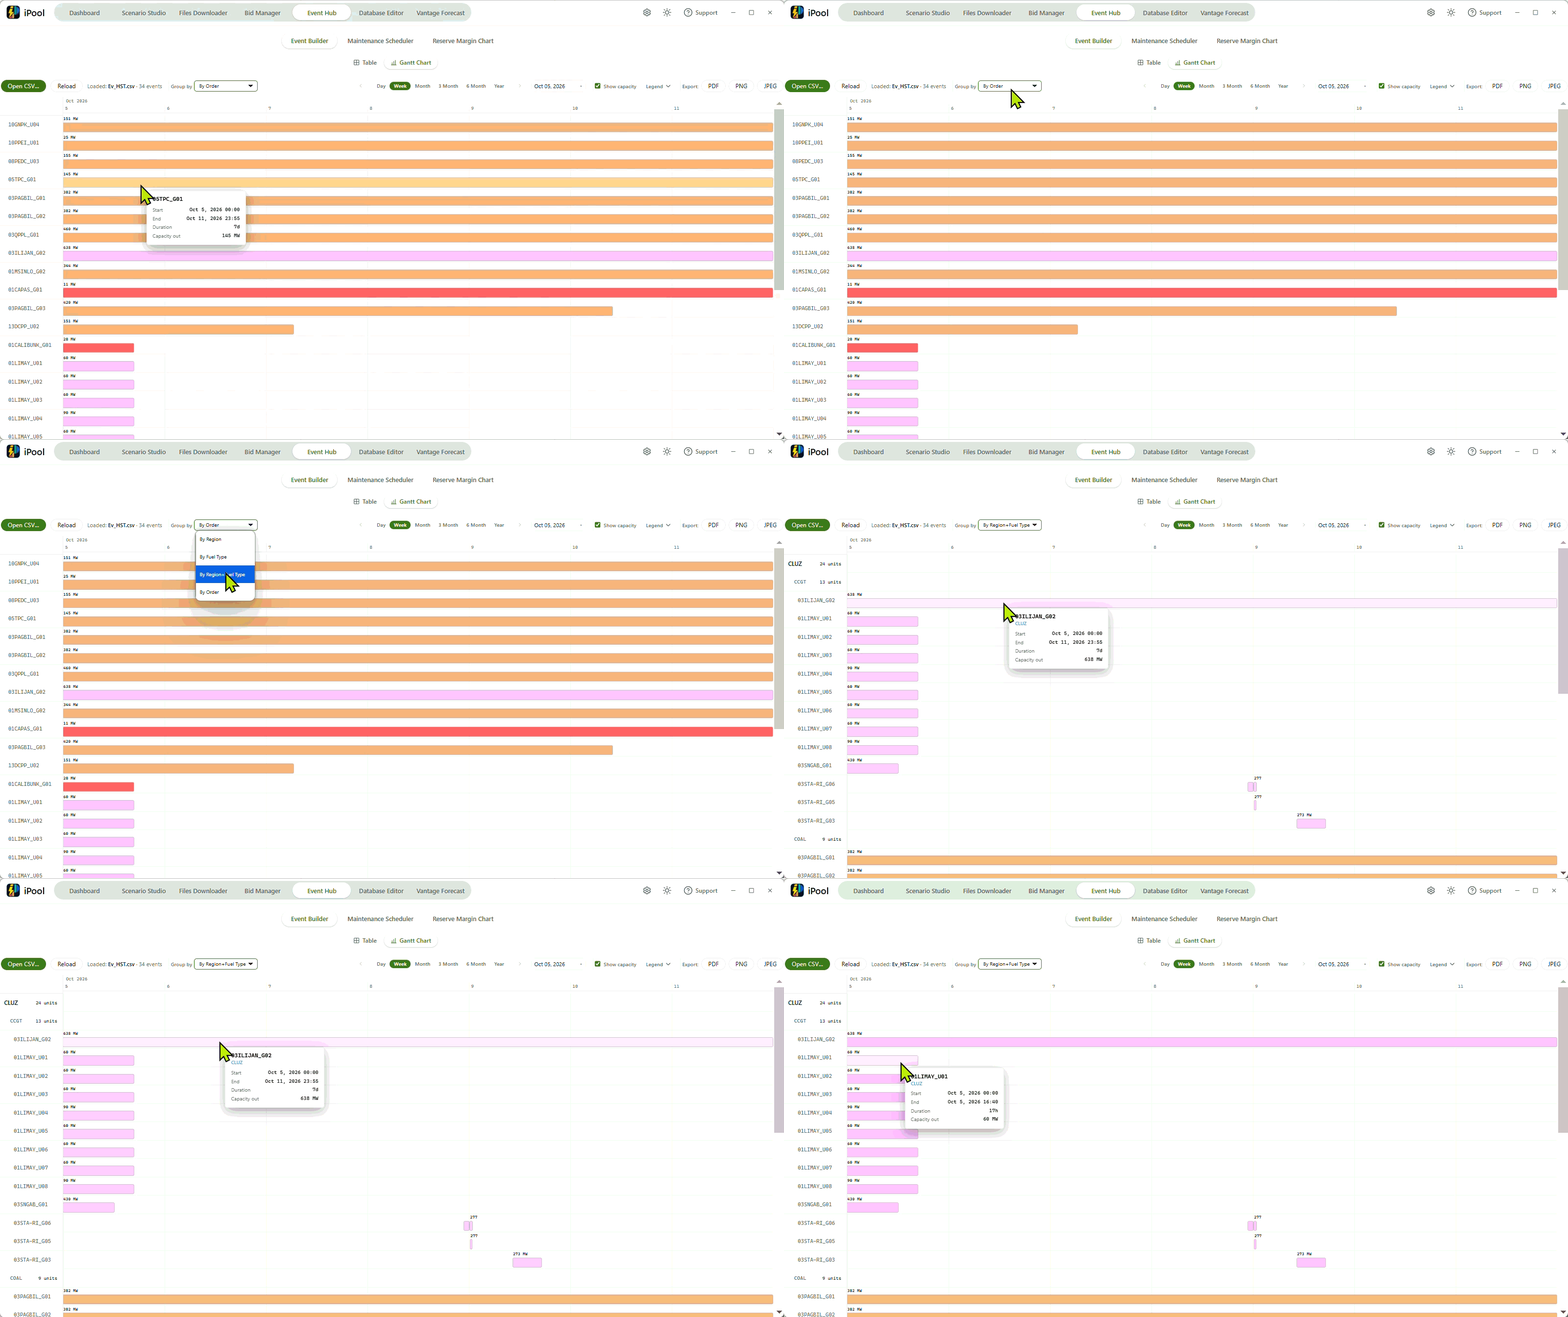
Once a file is loaded the chart lays events along a time axis. The
top ruler labels calendar months (for example Jun 2026) and the
bottom ruler shows per-day (or per-segment) ticks whose spacing
depends on the current view mode. The vertical axis is one lane per
generation unit, labelled at the sticky-left column by that unit's
DUID.
Each bar on the chart represents a single outage event on its lane. The bar's horizontal position and width come from the event's start-to-end date range. Bars are clamped to the visible window: if an event extends outside the current window the chart renders only the visible portion and draws a square edge on the clamped side as a visual cue that the event continues beyond the view.
Read a bar and the today marker
Each bar carries an on-bar capacity label whenever Show capacity is ticked. The label reads {N} MW at wider bar widths and collapses to
just {N} when the bar is narrow. The Show capacity checkbox in
the toolbar (on by default) hides these on-bar labels when unticked.
Hover any bar to see its full details in a tooltip. The tooltip
shows six lines: the unit, the region, Start and End timestamps,
the event's Duration, and the Capacity out.
When today falls inside the loaded data range the chart also draws a
vertical Today indicator line across the lanes, with a small
Today tag at the top of the ruler. The line is hidden whenever
today is outside the loaded range.
Use the toolbar to move the visible window and jump between dates.
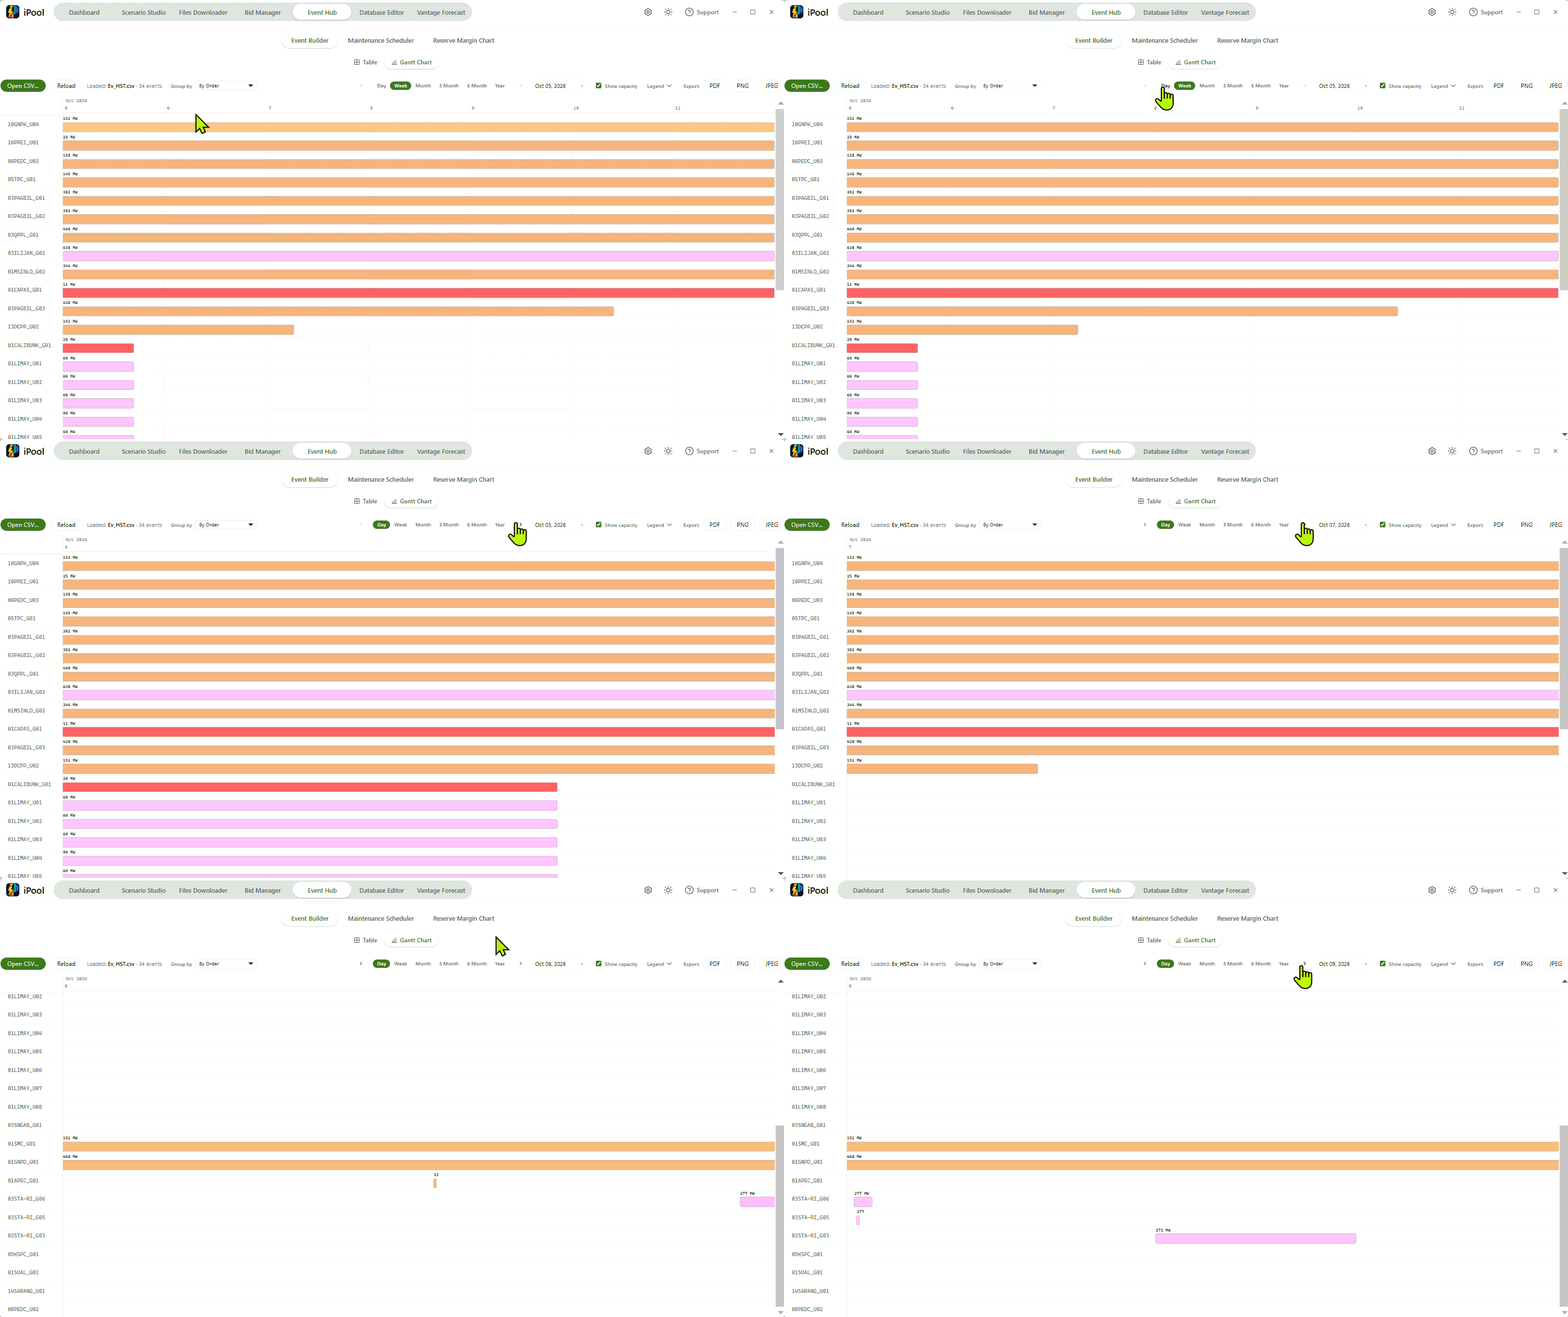
Move around the timeline
The toolbar gives you three ways to move.
The ‹ Prev and › Next arrow buttons step the visible window one increment at a time (the increment depends on the current view mode). They are disabled at the ends of the loaded data range.
Six buttons set the zoom level: Day, Week, Month, 3 Month, 6 Month, Year. Picking a level changes both the ruler tick density and how far the Prev/Next arrows move.
A calendar date picker lets you jump straight to any date inside the loaded data range; dates outside that range are disabled in the picker. When today happens to fall inside the loaded range the toolbar also shows a Jump to Today button that snaps the view to it in one press.
Choose how lanes are organised and coloured, then open the fuel legend when a fuel-coloured grouping is active.
Group and colour lanes
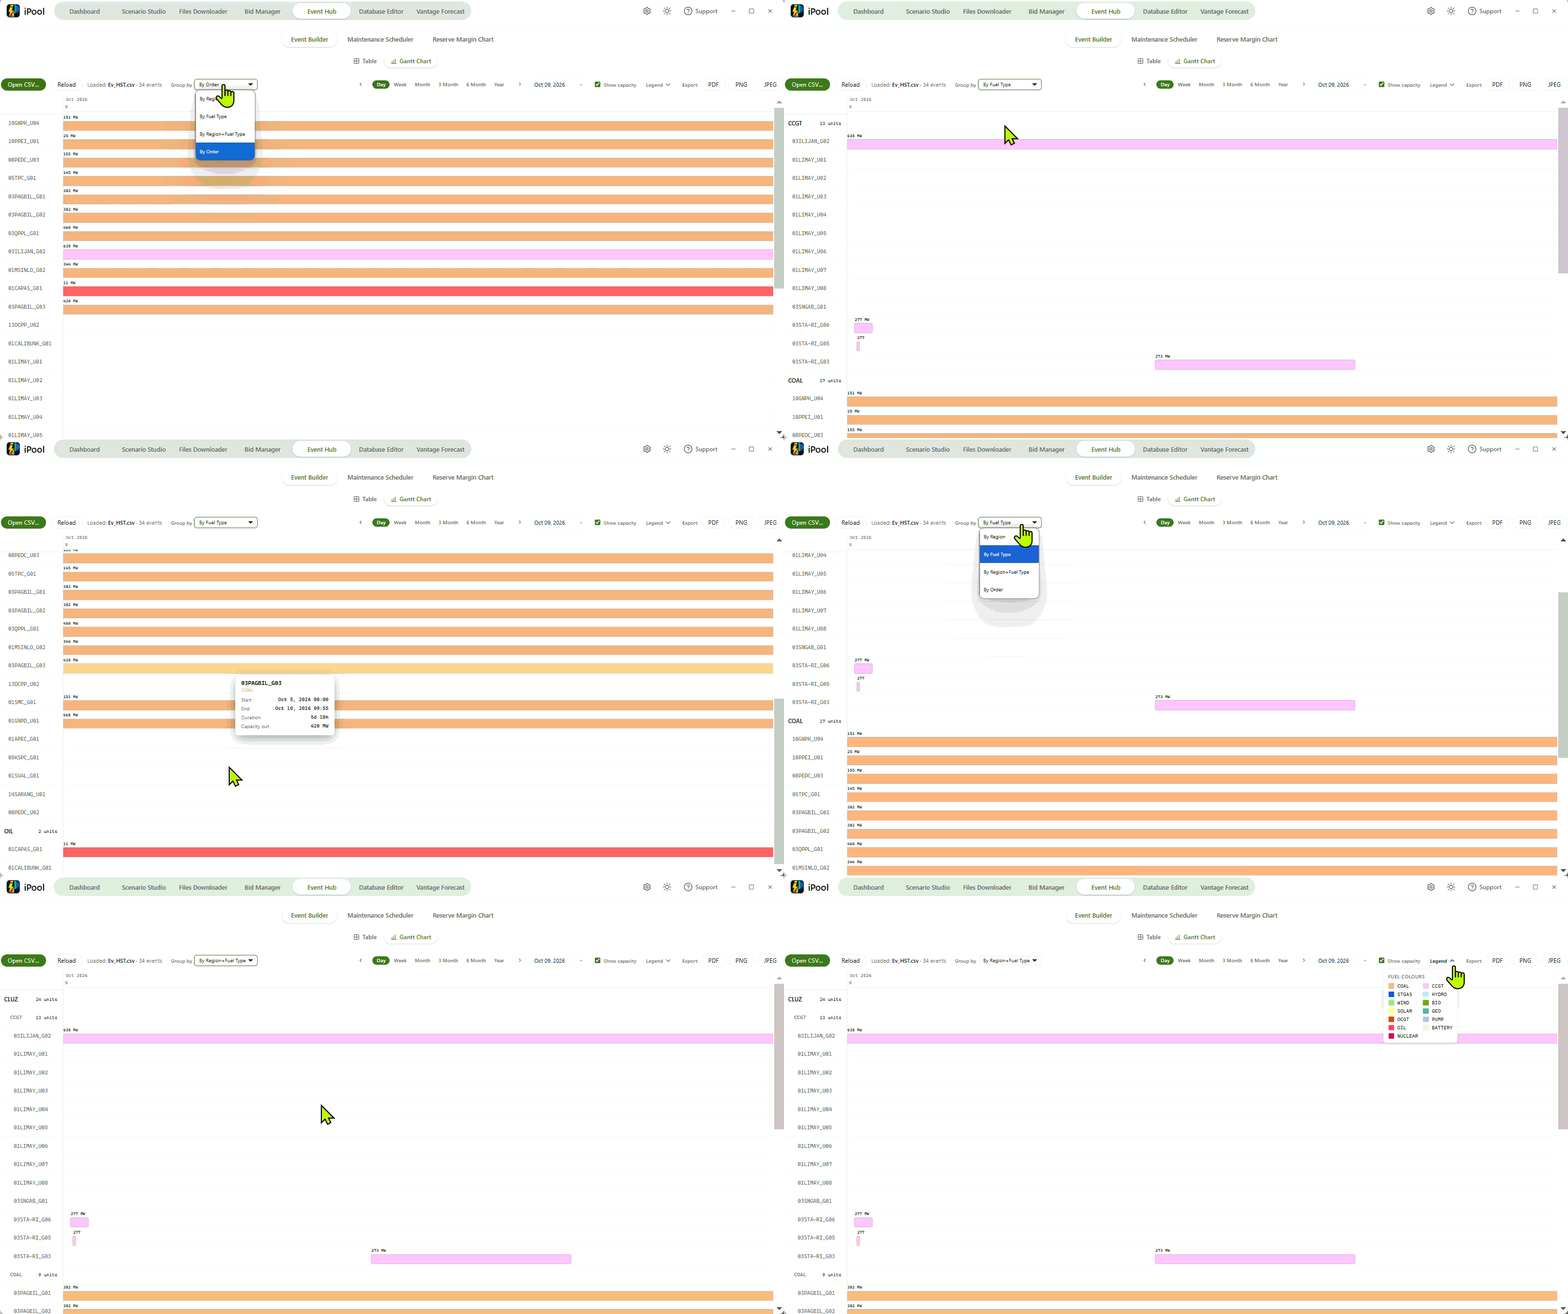
Use the Group by dropdown to change how lanes are organised and coloured. Four options are available:
- By Region — lanes are grouped under region headers; every bar is coloured by its unit's region.
- By Fuel Type — lanes are grouped under fuel-type headers and each group header is coloured to match the fuel; bars are coloured by fuel.
- By Region+Fuel Type — group headers show a region-coloured stripe while individual bars carry their fuel-type colour, so you can read region membership from the header and fuel from the bar.
- By Order — no group headers; every lane is shown in a single flat list and each bar is coloured by fuel.
Use these groupings to spot region-level or fuel-mix patterns before scheduling further outages.
Open the fuel legend
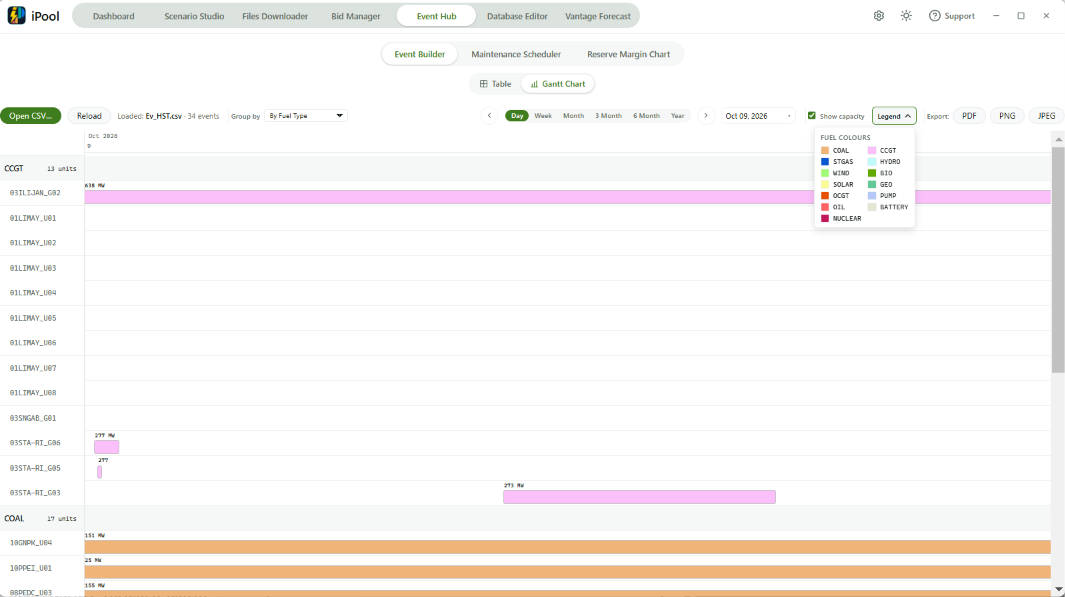
A Legend toggle appears whenever a fuel-coloured grouping is
active — By Fuel Type, By Region+Fuel Type, or By Order.
The toggle opens a popover titled Fuel colours listing the colour
swatch and code for each fuel. The popover opens automatically the
first time you enter a fuel-coloured grouping, then respects your
manual open or close state from then on. When the active grouping is
not fuel-coloured (for example By Region) the Legend toggle is
hidden.
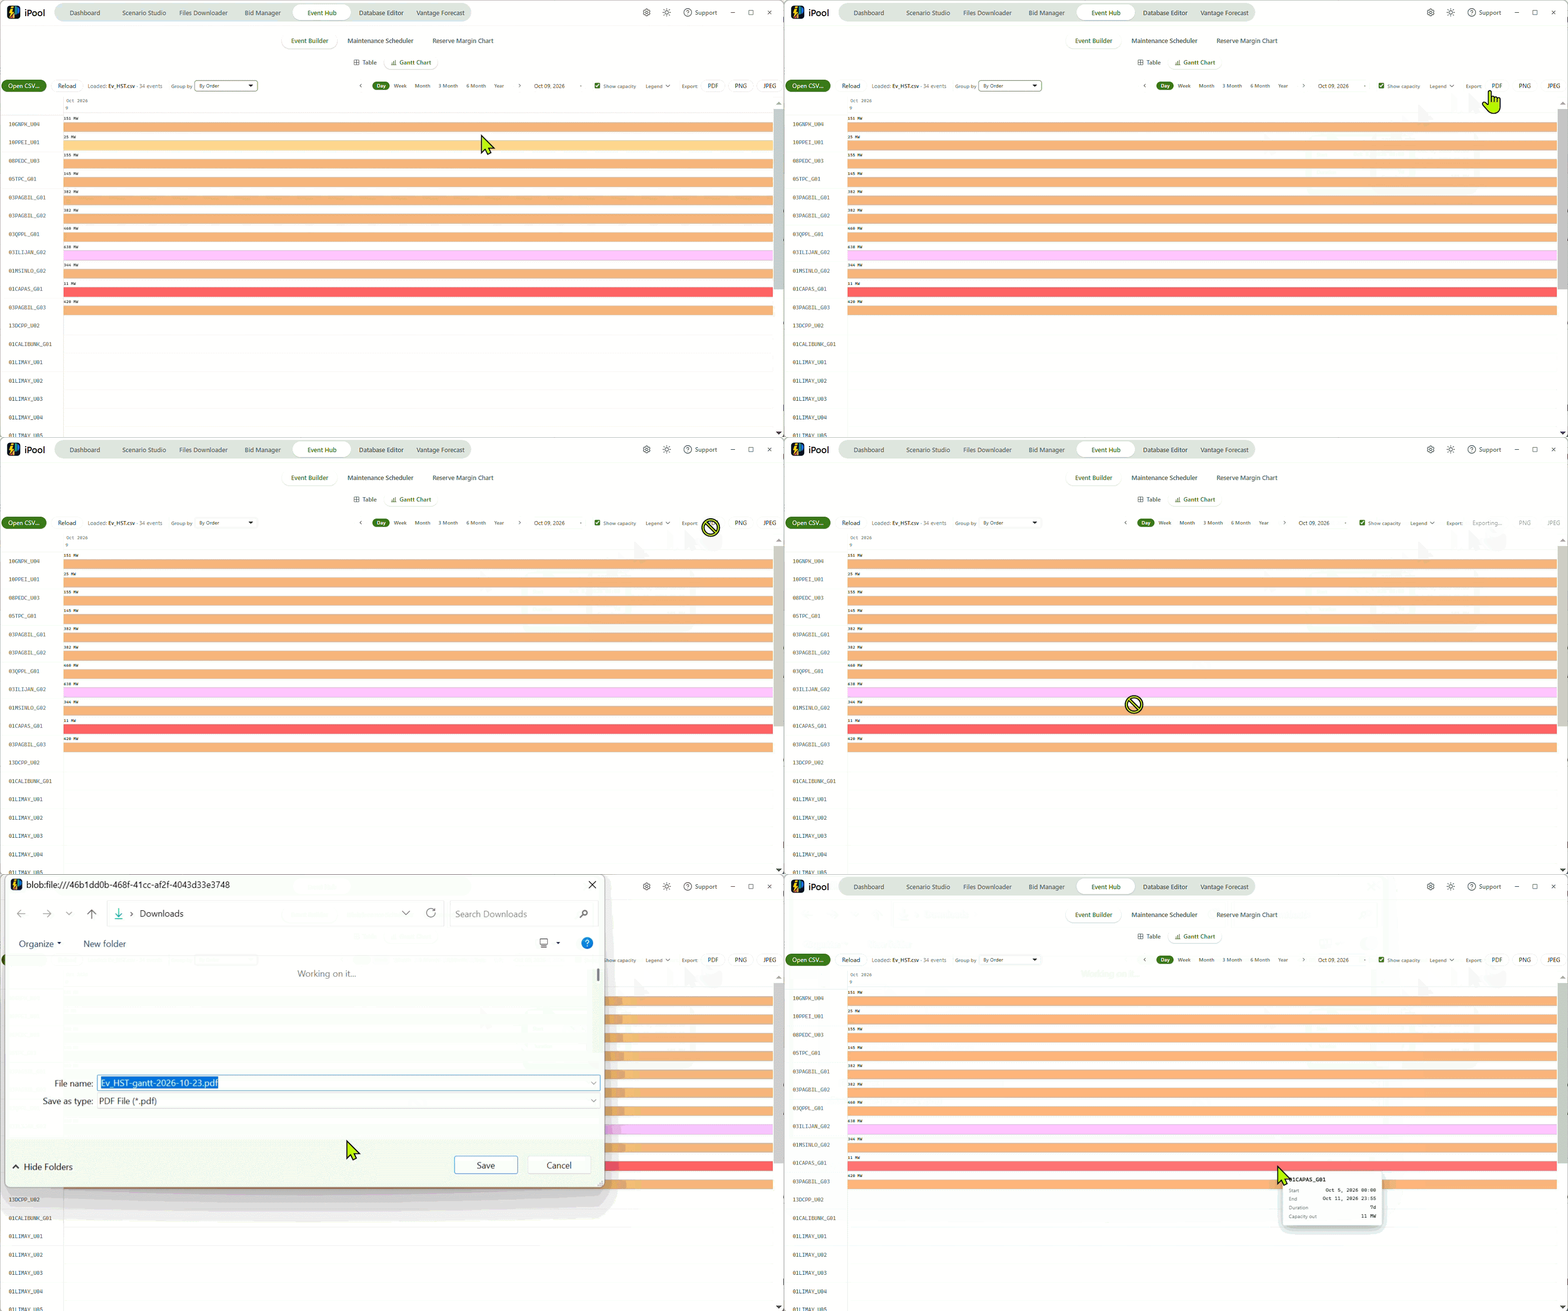
Save the current chart view to a file.
Export a chart snapshot
Use the Export: cluster on the right of the toolbar to save the
current view. Three per-format buttons are available: PDF,
PNG, and JPEG. Press any one to start that export. While an
export is in flight all three buttons are disabled; the button that
is running reads Exporting… in place of its label so you can see which
format is being produced, and the other two keep their format
labels.