Interface and Navigation
The Database Editor is the fourth tab in the iEnergy Suite. Keyboard shortcut: press 4 (while not in a text field) to switch to the tab. The tab shows an empty state ("Open a database to begin") until a .db file is loaded. Note: a separate "Database Editor" inside the Apollo tab edits JSON configuration files — that is a different tool and is not covered here.
Opening a Database
- Click Open Database in the top toolbar.
- On desktop: a native file picker opens, filtered to
.db,.sqlite,.sqlite3. - On web: a browser file input opens with the same extensions.
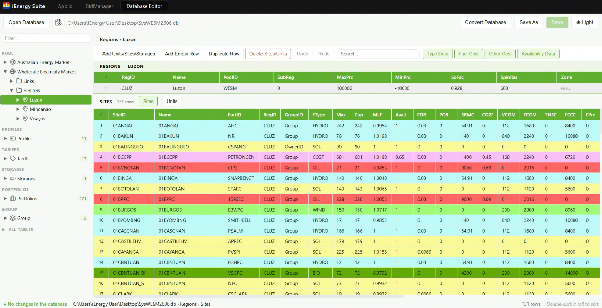
Screen Layout
Top Toolbar
Left side (in order):
| Button | Purpose |
|---|---|
| Open Database | Opens a database file. If there are unsaved changes, a "Discard & Open" confirmation prompt appears first; cancelling the file picker leaves the current database open. |
| (calendar/clock icon) | Opens the Time Periods database modal |
| (path display) | Shows the path of the currently open database |
| × | Closes the database (with unsaved-changes guard); only visible when a database is open |
Right side (in order):
| Button | Purpose |
|---|---|
| Update Database | Opens the modal to add or reconcile data; disabled when no database is open |
| Convert Database | Opens the Convert Database modal; always enabled |
| Download | Web only — downloads the current database file |
| Save As | Desktop only — saves a copy of the database |
| Save / Saving… | Writes all pending changes to disk; only enabled when there are unsaved changes |
| (theme icon) | Toggles light/dark mode |
Left Sidebar
The sidebar contains:
- Filter… input — hides tree nodes that do not match the typed text.
- Hierarchy section headers (uppercase): POOL, PROFILES, TARIFFS, CONTRACTS, STORAGES, PORTFOLIOS, GROUP. (Note: the database table is named "Meters" but the sidebar label is "PROFILES"; "Parts" is labelled "PORTFOLIOS".)
- Tree nodes with chevron expand/collapse, icon, display name, and row-count badge.
- Orange ● dirty indicator on table nodes that have unsaved changes.
- All Tables — collapsible section listing every database table alphabetically. Hidden system tables (
dprofs,linkprof,paste_errors) are not shown.
Panel Toolbar
Appears above the grid when a table is selected:
| Element | Purpose |
|---|---|
| Breadcrumb | Shows current context, e.g. "Sites" or "Sites › SITE001" |
| Add Empty Row | Adds a null-filled row below the selected row |
| Duplicate Row | Copies the selected row (confirmation dialog) |
| Delete Row / Delete Sites/Units | Deletes the selected row (confirmation dialog); label changes to "Delete Sites/Units" for those tables |
| Undo | Undoes the last change; disabled when no history |
| Redo | Redoes the last undone change; disabled when no redo stack |
| Search… | Filters grid rows to matching values |
| Type Data | Shows/hides the Type Data column group (Sites and Units only) |
| Fuel Cost | Shows/hides the Fuel Cost column group (Sites and Units only) |
| Other Cost | Shows/hides the Other Cost column group (Sites and Units only) |
| Availability Data | Shows/hides the Availability Data column group (Sites and Units only) |
Split View
When a record node with children is clicked, the grid area splits into two panels:
- Top panel (max 200 px): shows the parent row (e.g., a Region record).
- Bottom panel: shows the filtered child rows.
- For Regions, Group, and Portfolios parents: Sites and Units toggle buttons appear in the child panel header to switch between child types.
Status Bar
| Element | Description |
|---|---|
| Clear | Discards all pending changes (with confirmation); only visible when there are unsaved changes |
| Status indicator | ● No database open / ● Unsaved changes / ● All changes saved / ● No changes in the database |
| Path display | Current database path and active table |
| Row count | Number of rows in the active table |
| Hint | "Open a database to begin" / "Double-click a cell to edit" / "Click Save to write changes to disk" |
Power-System Hierarchy
The database organises power-system data around a hierarchy. The key levels are:
| Sidebar label | Database table | Key column | Description |
|---|---|---|---|
| POOL | Pool | — | Root simulation pool |
| PROFILES | Meters | MeterID | Demand/meter profiles; grouped by category |
| TARIFFS | Tariffs | TariffID | Tariff records |
| CONTRACTS | Contracts | — | Contract records |
| STORAGES | Storages | StorID | Battery and pumped-hydro storage |
| PORTFOLIOS | Parts | PartID | Participant portfolio records |
| GROUP | Group | ID | Fuel-type groupings of Sites |
Primary child tables accessible via the tree: Sites (power stations, key: SiteID), Units (individual generating units, key: DUID), Regions (grid regions, key: RegID), Links (network interconnections, key: LinkID).
The Pool node is expanded automatically when a database is opened.
Navigating the Tree
- Click a table node (e.g., POOL) → loads that table in the standalone grid view.
- Click a record node that has children (e.g., a region) → opens split view with the parent row at top and child rows below.
- Click a leaf record node → shows that single row in the grid. Breadcrumb reads "TableName › RecordName".
- Filter… in the sidebar narrows the tree to nodes matching the typed text.
- Search… in the panel toolbar filters grid rows to matching values.
- Sites / Units toggle buttons in the split view child header switch between Sites and Units child rows (available when the parent is Regions, Group, or Portfolios).
- All Tables — click to expand and see all database tables alphabetically. Click a table to view its rows directly.
- Click a chevron (▶) to expand a tree node; click ▼ to collapse it.
Change History
When there are unsaved changes, the status bar shows ● Unsaved changes in amber. Clicking this indicator opens the Change History popover, which lists every pending edit with the table name, column, and old and new values.
- Click any entry in the popover to navigate the grid directly to that row.
- Click Undo to here to discard all changes made after that point.